
When it comes to A/B testing Google Ads, experienced marketers have agreed on one thing for more than a decade: You can’t leave it to Google. You have to take control. The best practices on how to do this are also widely accepted. But guess what – it’s all nonsense. It doesn’t work and never has.
I’ve been saying this for years, but admittedly, had a hard time convincing people. Theoretical arguments are boring. This is why I’ve gathered and compiled a lot of data about ad tests – not your usual ad test data, but things you wouldn’t normally look at, some coming from a few wild experiments you shouldn’t try at home.
 Last year, I presented my findings at Hero Conf London. It must’ve been convincing as it was voted Best Overall Presentation. For SMX Munich, I expanded the topic with further data and more experiments.
In this and in a few more posts, I will share my findings and make the case against the approach that we call “best practice”.
The Search Marketing Best Practice of A/B Ad Testing
In our industry, a “state of the art” A/B test goes something like this:
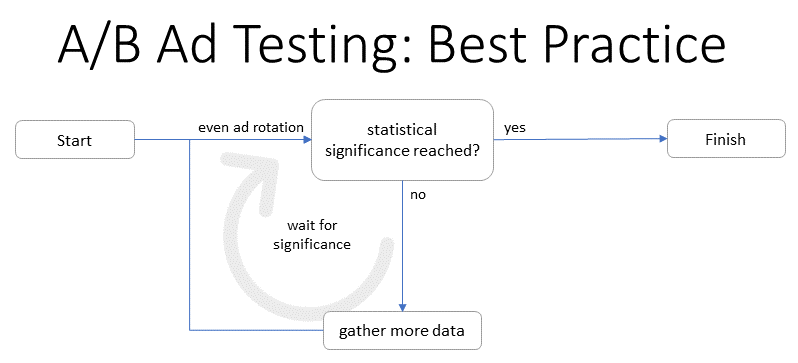
So basically, your test runs and gathers data until you’ve “reached” statistical significance (usually 95%). This approach is both simple and sophisticated and it comes with some fantastic advantages:
- You don’t have to rely on Google. You make your own decisions.
- You always know what to do. The formula may be complicated, but the result is not: It’s either significant or not.
- You look good. The client may question your decision to pick a winner, but once you mention statistical significance, people don’t want the details. You obviously know your stuff.
The only downside: it doesn’t work.
There are several reasons why it doesn’t work. I’ve found a couple of basic problems, which are actually independent of each other. Personally, I find all of them convincing, but each one by itself is enough to make it all useless.
In this post, let’s look at the first one, which is about how we make use of statistical significance.
How Not Taking No for an Answer Ruins Your A/B Tests
This is actually a mathematical problem and I realize that many smart people have written about this. However, there is a much less abstract way to look at this. The following 30 seconds from The Simpsons demonstrate this perfectly:
So what happened there? The kids asked a question and got an answer they didn’t like. So they asked again. And again. And again – until they got the answer they wanted.
This is basically what we do. Our question is: “is it significant, yet?” – and we don’t stop until we get the desired answer. When we have it, we stop asking and proclaim: “we’re 95% certain that this ad is the winner!”
Again, there is a smarter way to put this mathematically, but it boils down to this: If you won’t take no for an answer, then the odds for getting a yes go up. It simply makes no sense to assume that the probability for a false positive stays at 5%.
I realize this is still a theoretical argument. Having learned that I had a hard time convincing people with theoretical arguments alone, I gathered some data.
Experiment 1: A Regular A/B Test
Going through many accounts with a lot of history, we found some old campaigns that had once been running A/B tests with even ad rotation, where nobody ever bothered to act on the results. In total, we found 444 tests that ran untouched for a year.
We used a script to analyze the data retroactively, calculating significance levels for each day. For example, we took the performance data from days 1-10 and checked whether the results were 95% significant at day 10. We did the same for each day of the year and for each test.
The result was a table with 365×444 cells, each row representing a test. We then simply colored the cells to tell when the data was significant (red = ad 1 wins, blue = ad 2 wins). Up close, it looked like this:
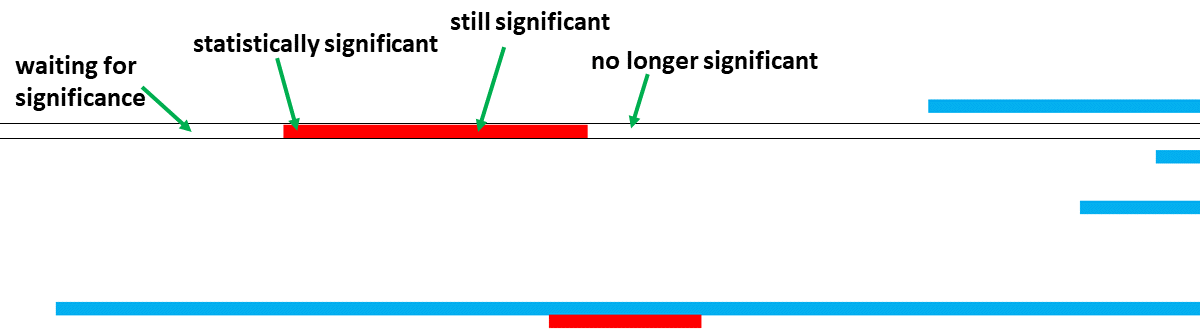
As you can see, significance isn’t just something to be reached: it comes and goes. At some point, the data may tell us we can be 95% sure, but with more data, that certainty sometimes goes away. The overall picture is a mess, but it’s not hard to see that many tests fluctuate:

Overall, 70% of the tests reached a significance level of 95% at some point during the year. However, only 45% still had this level in the end. This means that although 25% of the tests had reached the level at some point, with all the data in, we were not so certain anymore.
What we can learn from this: It makes a difference when you stop asking. Looking at a year of data is different from stopping a test at the first chance you get.
Experiment 2: An Irregular A/B Test
This was the experiment I presented at Hero Conf. At first, I didn’t tell anyone that something was off.
For this experiment, we ran 576 ad tests, each with two new ads on even rotation, and left them untouched for 12 months. We used the same script as mentioned above to check significance levels for each day. The same visualization as in the first experiment looks much more erratic:

Still, most tests reached those 95% significance at some point. It really only depended on the amount of data gathered:
- Tests with at least 1,000 impressions: 55% reached significance at least once.
- Tests with at least 10,000 impressions: 62% reached significance at least once.
- Tests with at least 100,000 impressions: 81% reached significance at least once.
At this point in my Hero Conf presentation, I asked the audience which important part about this experiment I had neglected to mention. The answer: These were all A/A tests. Each of those 576 tests consisted of two identical ads. Each time the formula told us we were 95% certain that one ad was better, we were actually 100% wrong.
What we can learn from this: If we don’t take no for an answer, we will get a yes at some point – even if it’s blatantly wrong.
Experiment 3: An A/B Test Under Lab Conditions
To me, the second experiment is already pretty convincing. However, I could understand if people were sceptic. Maybe there was a good reason for this result. Maybe we made a mistake. Or maybe it’s because CTR data from Google Ads cannot be trusted (we’ll get to that in the second part of this series).
To prove that our approach to A/B testing leads to useless results not just with Google Ads but in general, we did the simplest experiment we could think of: flipping coins.
It goes like this: We toss two coins and keep score on the number of times they come up heads. Each round we compare the numbers of both coins and check for a statistically significant difference (the usual 95%).
Of course, we didn’t actually throw around coins but we simulated this. For our experiment, we flipped both coins 1,000 times and ran this simulation 100,000 times.
The outcome: Even with these perfectly identical coins it was pretty easy to find statistically significant differences by simply not taking no for an answer.
Again, the number of positive results mainly depended on how long we waited, as shown in this chart:
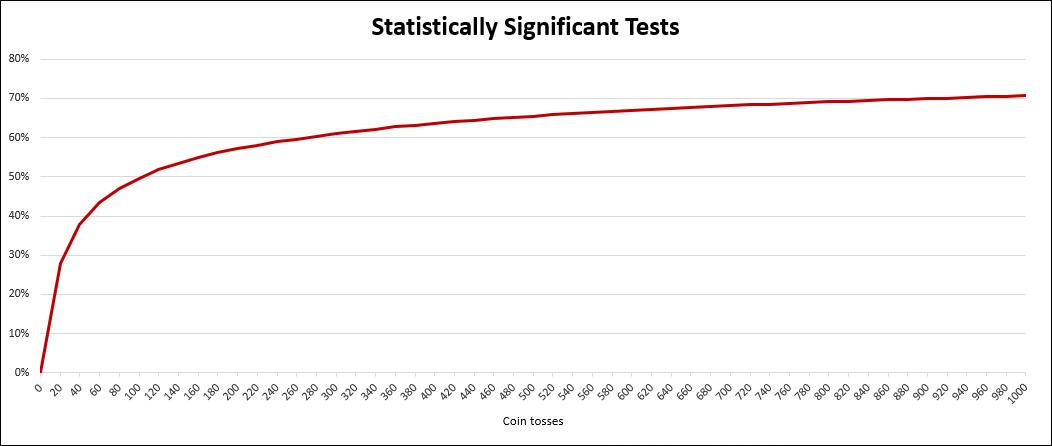
Even within the first 20 tosses (for each coin), we found a statistically significant difference in 28% of our simulations. Looking at the first 100 tosses, this number was already at 50%. Within the full 1,000 tosses it was 71% of all simulations.
The significance level of 95% should indicate that there is only a 5% chance of a result being a coincidence. Since the coins are identical, we know for a fact that all of these results are nothing but coincidence.
What can we learn from this? It’s not just ad testing: If we apply the same method to something as simple as identical coins, we will most likely find that they’re different – which is obviously not the case.
Conclusion
The way we use statistical significance in ad testing is designed to get us the answer that we want – not the answer that is correct.
That doesn’t mean the answer will always be wrong. But it means that the whole exercise is pointless. You can base your decisions on reaching those 95%, but the number is inconsequential. Calculating statistical significance simply doesn’t add any value.
What’s next?
The second part of this series will be about how unreliable data makes A/B testing impossible – regardless of the statistical methods you use.

Martin Roettgerding is the head of SEM at SEO/SEM agency Bloofusion Germany. You can find him on LinkedIn.