
Ad tests rely on data. The first part of this series was about how using the data the wrong way leads to questionable decisions. This second part is about the data itself being questionable.
In the first part of this series I demonstrated where statistical significance leads us astray. For this part, we can forget all about the way we evaluate the data.
To demonstrate where it all goes wrong, I collected some examples and a lot of data. To keep things simple, let’s just focus on click-through rate.
For starters, look at this example:
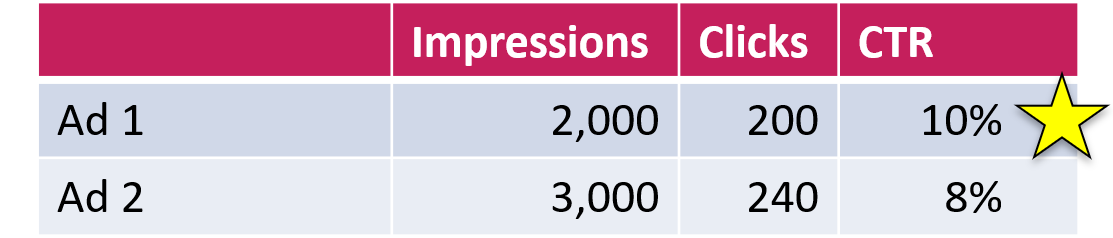
Which ad does better in terms of generating clicks from impressions? Based on the data, it’s clearly the first one.
When we look at the data to determine winners, we tend to see an ad as the sole driver of its performance. Implicitly, our imagination is that an ad itself determines its CTR.

In reality, the contents of an ad are just one of many aspects that influence CTR. Let’s look at a few.
Ad Networks as a Driver of CTR
When we think of Google search ads, we tend to think about them in the context of a Google search. What we tend to forget is that many advertisers also have their ads showing on search partners.
According to Google:
On search partners sites, your ads can appear on search results pages, on site directory pages, or on other pages related to a person’s search.
Some search partners are indeed search engines (which usually get their results from Google). These sites include ads as relevant answers to search queries.
Yet most of the impressions from search partners come from sites like eBay, where ads are included as inconspicuous text ads at the bottom of long pages full of visually appealing search results. Unlike Google users, the few people who actually see these ads are not looking to go to another site. All of this leads to very low click-through rates.
While we can’t look at the data from individual search partners, you can easily segment ad performance by network. Let’s do this with the initial example:
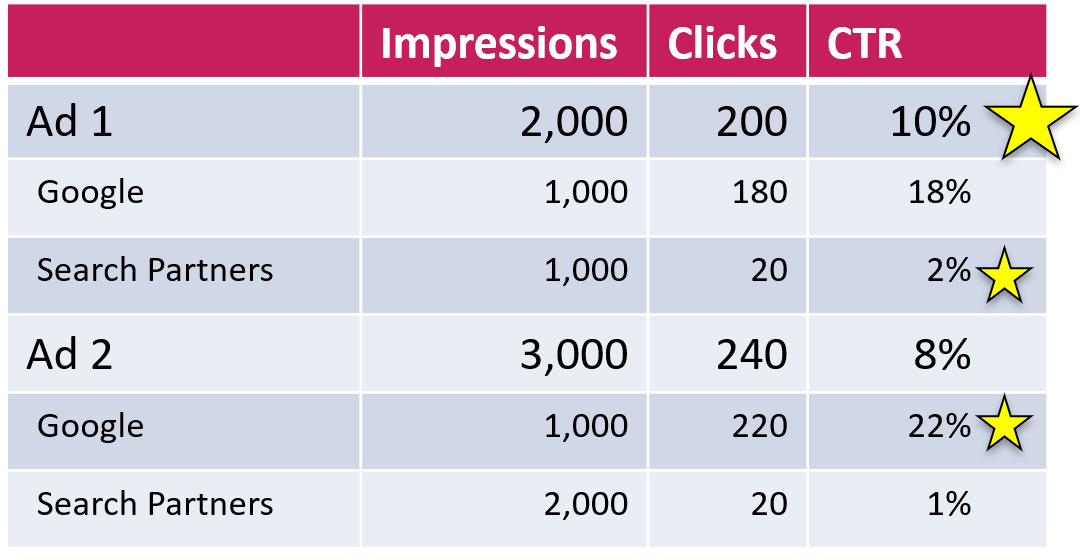
As you can see, the first ad has the better CTR on search partners and the second one does better on Google. Overall, the first ad wins.
In this case, the overall winner is not the one that wins on Google. This is not ideal, considering that the traffic from Google is usually more valuable than search partner traffic. Still, this is just some made-up example. The question is: How common is this in reality?
To find out, we did a study on our ads. Using a script, we evaluated the data from 6,500 ad pairs. The result: in about a third of all cases we had one ad that had the highest CTR overall, but wasn’t the winner on Google.

So having a winner ad that loses on Google – no big deal? Maybe not, but it gets worse. To demonstrate, let’s modify the example a bit. Let’s say, the second ad generated 50 clicks (instead of 20) from search partners. Now the situation would look like this:
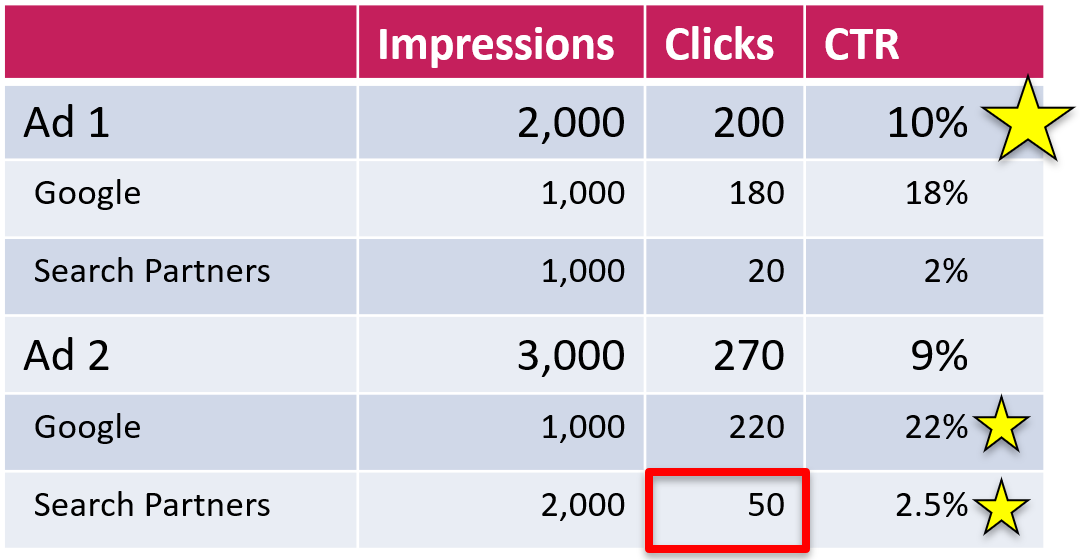
As you can see, the second ad now wins on all fronts. It outperforms the first one on Google and on Search Partners. Yet the first ad still wins according to the overall numbers.
Even though this is counter-intuitive, there’s a simple explanation: the second ad had twice as many impressions from search partners, which dragged down its average CTR. This phenomenon is known as Simpson’s paradox.
Again, we wanted to know how common this is and used the same script to check. The result: one in eight ad tests has its totals point in the wrong direction.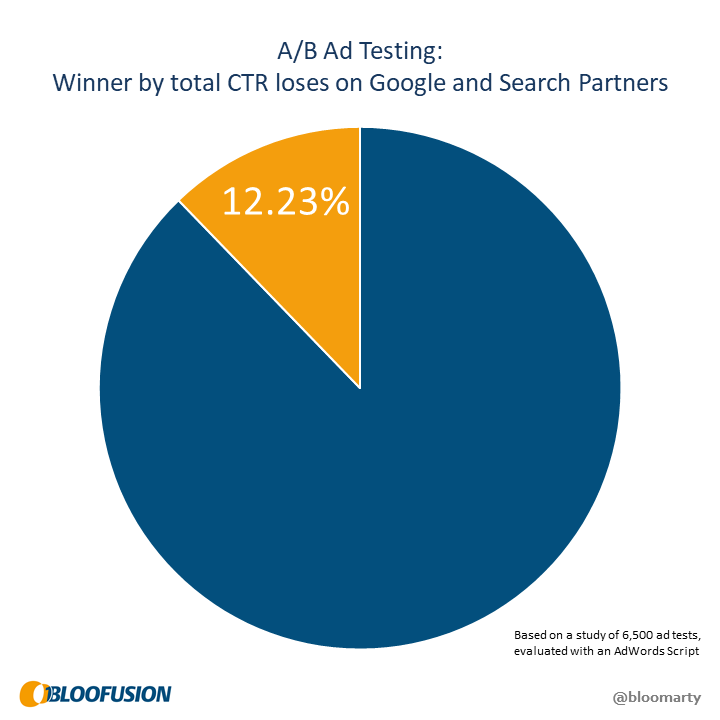
Now there’s no question that this is really too bad. Looking at the overall numbers sometimes gives as a false winner that actually loses on all fronts.
Lucky for us, there’s an easy solution to get rid of this problem: just ignore search partners and only look at the numbers from Google. If you never targeted search partners in the first place, you’re in the clear already. However, this only gets us so far …
Ad Slots as a Driver of CTR
On Google search, ads can appear above the organic search results, or below. These placements can be evaluated by using the Top vs. Other segmentation in Google Ads, or by including the slot field in an API report.
Looking at Top vs. Other, we basically find the same potential problems we just saw with the networks: The overall numbers may point to one winner whereas the segmented numbers tell a different story.
Again, we used a script to find out how much of a problem this actually is. First, we evaluated how often the overall winner wasn’t the winner in the top results:

The question here is what to do with this. Does the winner have to be the winner in the top results as well? Should we just ignore this and only look at the totals? Or do we only look at top results to determine the winner? All I can say for sure is that this question is ignored when following best practices.
The more interesting case is, of course, the paradox, where the apparent winner actually loses on both fronts. Based on our data, this is the case in one of 16 ad tests:
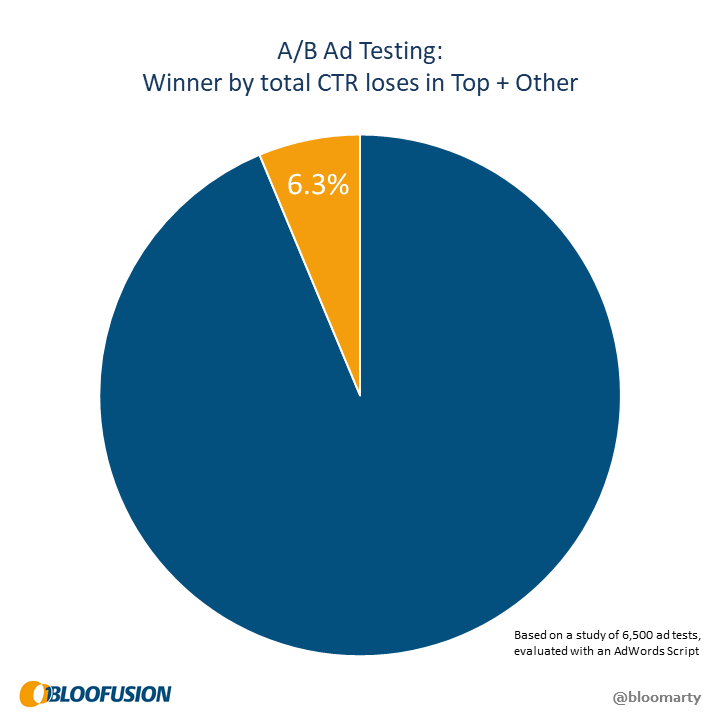
This is not as bad as the twelve percent from the networks, but this one affects everyone (unlike search partners, every campaign covers top and other slots). If you think back to statistical significance, this raises an interesting question: How can you strive for 95% confidence if six percent of your ad tests point to the wrong winner?
Ad position
There is no doubt that ad position is a major driver of click-through rate. Unfortunately, this aspect mostly eludes us.
Evaluating ad performance by position is hard, and basically impossible for any practical application such as ad testing. Google only gives us average position as a metric (instead of exact position as a dimension), which doesn’t tell much.
Over the years, I’ve often witnessed that people tend to say “position” instead of “average position”. People also tend to think that positions 1-4 are above and the rest are below the organic search results. Often, this is even true for people who actually know better.
We can improve on this a lot by segmenting the data by slot (top vs. other), which will immediately tell us whether position 1.0 was in fact above or below the organic search results. This also takes care of the distortive influence of search partners. To illustrate this point, here’s an example:

in this example, total CTR and average position are heavily distorted by the “other” slot from search partners. Segmenting the data gives us a much clearer picture. Still, even with this, average position data is not as clear and reliable as one might think.
To prove this point, we used the API to analyze data from Google’s top slot. We gathered as many data points as possible (each keyword, each day, each device, excluding brand campaigns) and aggregated them by average position. The result is the following chart, depicting click-through rate by average position.
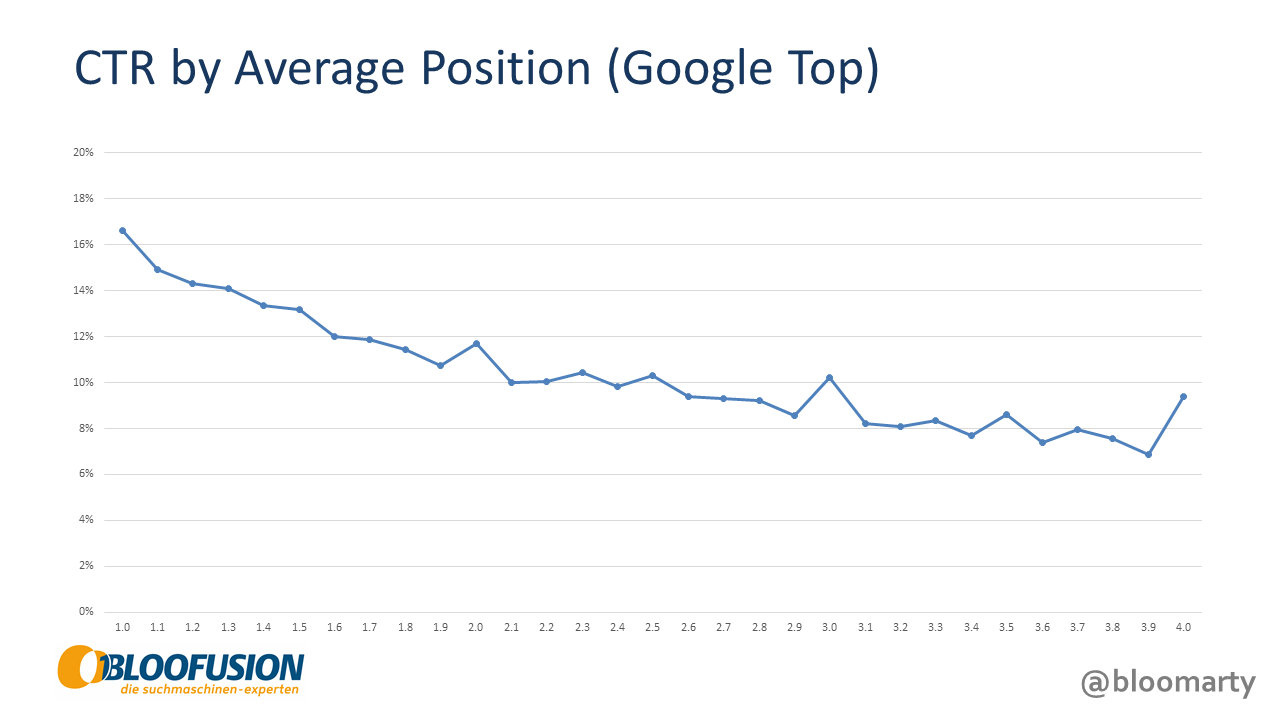
You might notice that the line has its ups and downs. For example, the click-through rate for average position 2.0 is higher than the one for 1.9. This happens a few times: As average position decreases, CTR sometimes goes up.
So what does this tell us? It’s simple: Average position is not the same as position and should not be treated as such. While the influence of ad position on CTR is undisputed, there is no reliable metric which would let us account for this.
Conclusion
There are more aspects to look at, but I hope the point became clear: An ad’s click-through rate depends on many things beyond the ad itself. Our best practices only revolve around total numbers and thereby ignore these influences completely. This often leads to the wrong conclusion.
Unfortunately, there’s no solution in sight. You can see a few things by segmenting your data, which can sometimes help. In most cases, however, this will only demonstrate how complicated and contradictory everything is. In addition, there are many more aspects that you cannot evaluate through segments (audiences, for example).
In the end, there’s little you can do to salvage this. The numbers that Google provides are simply not a reliable basis to evaluate ad performance. Picking winners based on this data comes down to an old truth from computer science: garbage in, garbage out.

Martin Roettgerding is the head of SEM at SEO/SEM agency Bloofusion Germany. You can find him on LinkedIn.