
Evaluating an ad test is all about aggregated data. In the last edition of this series, I demonstrated how this can lead to the wrong conclusions by going just below the top level. Today we’ll take a look at the lowest level.
Unfortunately, there’s no way to gather a meaningful amount of data on what actually happens when an individual user generates an ad impression. Unlike the previous parts, this one is based on imagination instead of data.
Let’s take a look at a few examples I made up:
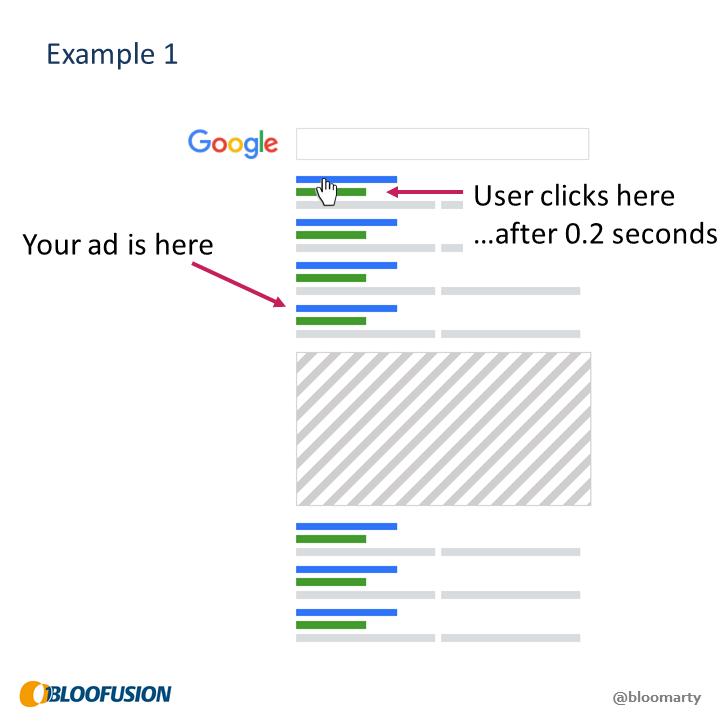
In the first example, the user clicks on the first ad so fast, they can’t possibly have seen much. What does this say about your ad?
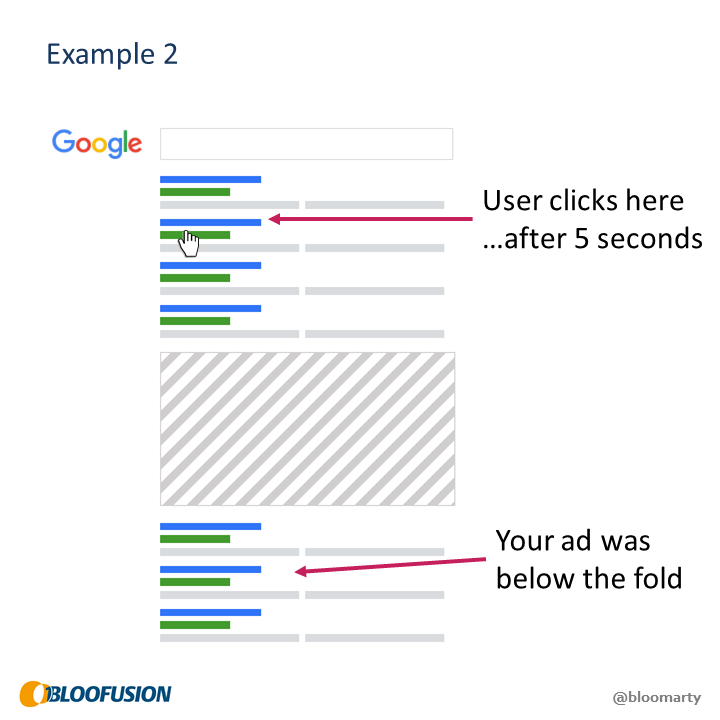
In example 2, the user takes a bit more time to choose another ad. Your ad was never visible. What does this say about your ad?
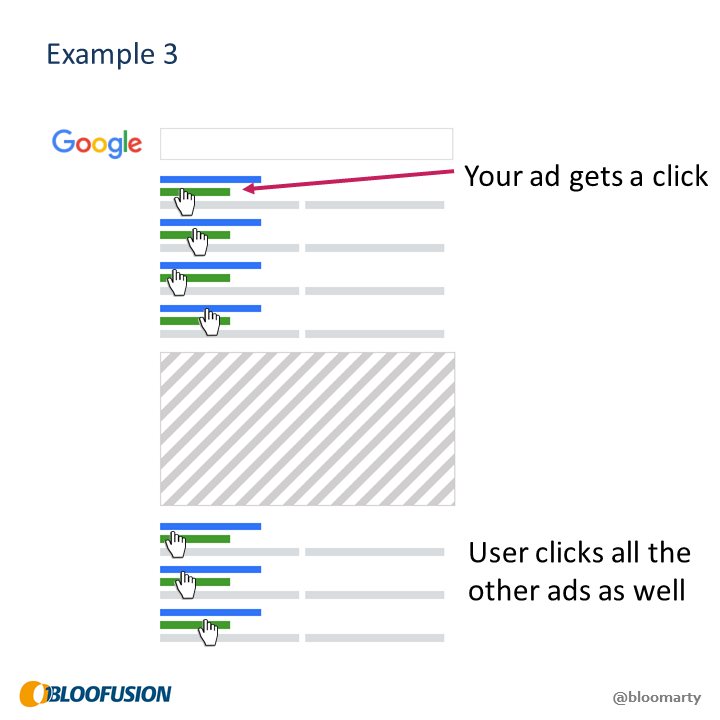
In the third example your ad gets its first click. However, the user just clicked on all ads to open them in new browser tabs. What does this say about your ad?

Example 4 is our happy ending. The user took a long look at the search results before deciding to click your ad. What does this say about your ad?
What do these say about your ad?
These examples are all made up, but they’re not unrealistic. Things like this happen all the time. In all of these examples, an impression is counted for each of the ads on the page – regardless of whether it was actually seen.
How would you evaluate the performance of your ad in these examples? The answer is simple:
- 4 impressions
- 2 clicks
- CTR: 50%
That’s the big picture. It’s all we have. But it’s not enough to evaluate an ad.
Conclusion
The conclusion is basically the same as last time: It’s not just the ad itself that drives its CTR. At higher aggregation levels, it was possible to prove these effects and their consequences with data. For the individual ad impression, examples and common sense are all I have to offer.

Martin Roettgerding is the head of SEM at SEO/SEM agency Bloofusion Germany. You can find him on LinkedIn.