
It’s bigger, it’s better, and it’s official: The new Quality Score Tracker is finally available!
The Quality Score Tracker is a free AdWords script that keeps track of an account’s Quality Scores. The previous version is still incredibly popular, but it’s three years old by now. This is why I created a new one that’s much faster and has some fancy new features.
The new version is different from the old ones in several aspects. A major objective was to write a script that’s as easy to use as possible – even easier than the old ones. The new Quality Score Tracker can be used right away, without any further setup.
While being easy to use the new script is very complex and handles a lot of things without bothering the user.
Here’s what it does:
Quality Score Tracking
The Quality Score Tracker saves your keywords’ Quality Scores in a spreadsheet. Unlike with the previous versions you don’t have to choose which ones – it tracks all of them. This allows you to go back and look up the history for any of your keywords later.
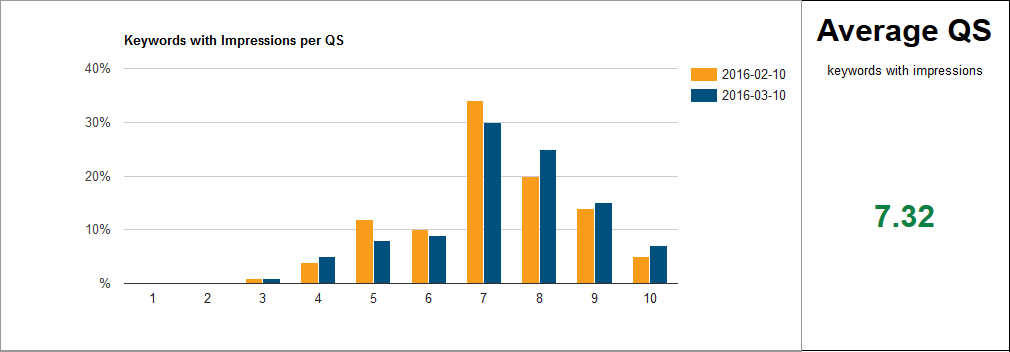
Dashboard
While tracking thousands of individual Quality Scores may be helpful later, the script also provides a dashboard to show you where you currently stand.

The dashboard is provided in a Google spreadsheet as well. This spreadsheet also provides summarized data about your Quality Scores.
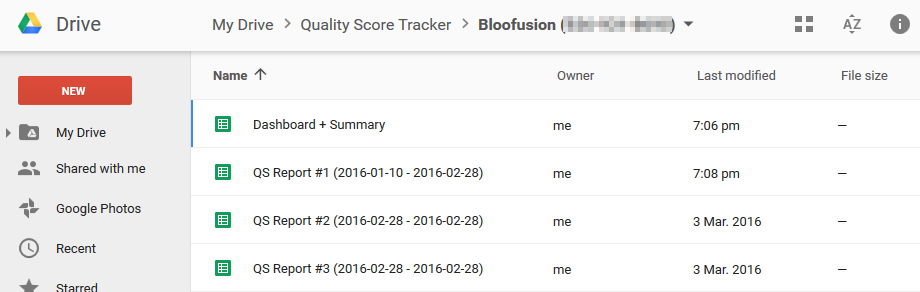
Google Drive
All files (dashboard and tracked keyword Quality Scores) are stored in a folder in your Google Drive. You can access them through your browser, or use all of the Google Drive features, like synchronizing the folder with your device, or sharing folders with others.
There’s a limit on how many cells a Google spreadsheet can hold (two million). Should you reach this limit while tracking Quality Scores, the script just creates additional spreadsheets. Spreadsheet files are named and numbered so you can put everything together later, if needed.
Since everything is in Google Spreadsheet files, the occupied space doesn’t count towards your Google Drive storage limit.
Customizable
The script provides a number of settings you can change (but you don’t have to). For example, you can add other charts to the dashboard, like a click weighted Quality Score.
Integrated FAQ
The dashboard comes with an FAQ that is updated every time the script runs.
More to come!
The script is already pretty complex, but I have a couple of ideas for new features that I want to add in the future (an MCC version is probably next). When a new version is available, a subtle reminder is added to the dashboard.
![]()
The latest version of the script will always be available at this URL: /qstracker/latest
Quick Setup
Since the script works out of the box, setting it up is easy.
-
Get the code (see below) and paste it into your account.
-
Schedule the script to run daily. Recommendation: 1:00 am.
-
Run the script for the first time. Check the logs to find the URL to your dashboard, or find everything in your Google Drive.
Detailed Setup
In AdWords, navigate to Bulk operations and then Scripts. Click +Script. Paste the script from the end of this post. Name it “Quality Score Tracker v3.0”. Click Save and then Authorize now.
Go back to Scripts and find the Quality Score Tracker at the top of the list. Click +Create Schedule. As frequency select “Daily”, along with a time of your convenience. Recommendation: 1:00 am. Click Save.
Click Run, then scroll down to see the script running under Logs. With big accounts, this can take a while, otherwise it could be done in 15 seconds. Click Logs on the right hand side. In the next screen, click on the Logs button on top. Now the URL’s for the dashboard and the Google Drive folder are displayed. As an alternative, you can find everything in your Google Drive.
Have fun!
Allright, that’s it. Get the script from below and get started!
[spoiler title=’The Script’ style=’default’ collapse_link=’true’]
/* * * * * * * * * * * * * * * * * * * * * * * * * * * * * * *
* Quality Score Tracker v3.0.1
* Written by Martin Roettgerding.
* © 2016 Martin Roettgerding, Bloofusion Germany GmbH.
* www.ppc-epiphany.com/qstracker/latest
*/
function main(){
  /*
  * The following preferences can be changed to customize this script.
  * Most of options can be set by using 1 for yes or 0 for no.
  * You don't have to change anything here. The script will do fine with the defaults.
  */
  var config = {
    /*
    * Which of the following charts should be displayed on the dashboard?
    * The "per QS" charts are column charts. They show the current state compared to a previous one (see next option).
    * "Average" and "weighted" charts are line charts, showing changes over time.
    */
    "chartsToDisplay" : {
      "Keywords per QS" : 0,
      "Average QS" : 0,
      "Keywords with Impressions per QS" : 1,
      "Average QS for Keywords with Impressions" : 0,
      "Impressions per QS" : 0,
      "Impression weighted QS" : 1,
      "Clicks per QS" : 0,
      "Click weighted QS" : 0,
      "Conversions per QS" : 0,
      "Conversion weighted QS" : 0,
      "Conversion value per QS" : 0,
      "Conversion value weighted QS" : 0,
    },
    /*
    * Column charts can show a former date for comparison. Set the number of steps you want to go back for this.
    * Note that the date you're comparing this to will depend on how often you've run the script in the past.
    * Example: If the setting is 30 and you ran the script daily, your comparison will be with the values from 30 days before. If you ran it hourly, it will be with values from 30 hours before.
    * If you haven't run the script often enough, the comparison will go as far back as possible.
    * Put 0 to disable the comparison.
    */
    "chartsCompareStepsBack" : 30,
    /*
    * When stats are taken into account (like impressions per QS, or impression weighted QS), this timeframe is used.
    * Note that this affects the values to be tracked and stored. Past values that are already stored won't be affected.
    * Use one of the following: TODAY, YESTERDAY, LAST_7_DAYS, THIS_WEEK_SUN_TODAY, THIS_WEEK_MON_TODAY, LAST_WEEK, LAST_14_DAYS, LAST_30_DAYS, LAST_BUSINESS_WEEK, LAST_WEEK_SUN_SAT, THIS_MONTH
    */
    "statsTimeframe" : "LAST_30_DAYS",
    /*
    * Whether to only look at stats from Google (e.g. for impression weighted QS).
    * Recommended. Quality Score itself only reflects data from Google, so weighting should only take Google into account and leave out search partners.
    * Note that this affects the values to be tracked and stored. Past values that are already stored won't be affected.
    */
    "googleOnly" : 1,
    /*
    * Whether to only track active keywords. This means that the keyword, the adgroup, and the campaign have to be enabled.
    * Recommended. Otherwise inactive keywords with meaningless Quality Scores might skew your data.
    */
    "activeKeywordsOnly" : 1,
    /*
    * Set to 1 if you want your dates (in charts, table headers, and file names) to contain hours and minutes as well.
    * Do this if you want to run the script hourly.
    */
    "useHours" : 0,
    /*
    * Use this option to not keep track of individual keywords' Quality Scores and only save data to the dashboard file.
    * This makes sense if you have more than 400,000 keywords. Note that you don't have to change this: The script will notice on its own and log a message otherwise.
    */
    "skipIndividualKeywords" : 0,
    /*
    * The name of the file where dashboard and summarized data are stored.
    */
    "summaryFileName" : "Dashboard + Summary",
    /*
    * The base folder for all Quality Score Tracker files.
    */
    "baseFolder" : "Quality Score Tracker/",
    /*
    * Whether to add a client folder in the base folder (resulting in a folder like "Quality Score Tracker/CLIENT_NAME (123-456-7890)/")
    * The folder's name is not important, as long as the Adwords client id remains in it.
    * This is useful if you want to track multiple accounts with this script.
    */
    "useClientFolder" : 1,
  }

  trackQS(config);
}

function trackQS(config){
  var version = "3.0";

  if(config['useHours']) var dateString = Utilities.formatDate(new Date(), AdWordsApp.currentAccount().getTimeZone(), "yyyy-MM-dd HH:mm");
  else var dateString = Utilities.formatDate(new Date(), AdWordsApp.currentAccount().getTimeZone(), "yyyy-MM-dd");

  var folder = getOrCreateFolder(config['baseFolder']);
  if(config['useClientFolder']) folder = getOrCreateClientFolder(folder);

  // Find the latest report file in the folder.
  var maxFileNumber = 0;
  var reportFile;
  var summaryFile;
  var fileIterator = folder.getFiles();
  while(fileIterator.hasNext()){
    var file = fileIterator.next();
    var matches = new RegExp(' #([0-9]+) ').exec(file.getName());
    if(matches && parseInt(matches[1]) > maxFileNumber){
      maxFileNumber = parseInt(matches[1]);
      reportFile = file;
    }else if(file.getName() == config['summaryFileName']) summaryFile = file;
  }

  // No report file found? Add a new one.
  if(maxFileNumber == 0){
    reportFile = addReportFile(folder, "QS Report #1 (" + dateString + ")");
    maxFileNumber = 1;
  }
  // No summary file found? Add a new one.
  if(!summaryFile) summaryFile = addSummaryFile(folder, config['summaryFileName']);

  Logger.log("All files are stored at");
  Logger.log(folder.getUrl());
  Logger.log("The dashboard is here:");
  Logger.log(summaryFile.getUrl());

  var spreadsheet = SpreadsheetApp.open(reportFile);
  var sheet = spreadsheet.getActiveSheet();
  var lastRowNumber = sheet.getLastRow();
  var sheetLastColumn = sheet.getLastColumn();
  var idColumnValues = sheet.getRange(1, 4, lastRowNumber, 1).getValues();
  var summarySpreadsheet = SpreadsheetApp.open(summaryFile);
  updateInfo(summarySpreadsheet, version);
  var sheetCharts = summarySpreadsheet.getSheetByName("Dashboard");

  summarySpreadsheet.setActiveSheet(sheetCharts);
  summarySpreadsheet.moveActiveSheet(1);

  // Track an event in Google Analytics.
  trackInAnalytics(version);

  // Remember the line number for every keyword.
  var lineNumbers = {};
  for(var i = 1; i  0) qsStats['Keywords with impressions'][row['QualityScore']]++;
    qsStats['Impressions'][row['QualityScore']] += parseInt(row['Impressions']);
    qsStats['Clicks'][row['QualityScore']] += parseInt(row['Clicks']);
    qsStats['Conversions'][row['QualityScore']] += parseInt(row['Conversions']);
    qsStats['Conversion value'][row['QualityScore']] += parseInt(row['ConversionValue']);

    // Save the individual keyword's Quality Score.
    if(!config['skipIndividualKeywords']){
      var id = row['CampaignId']+"_"+row['AdGroupId']+"_"+row['Id'];
      // Check if there is already a line for this keyword
      if(lineNumbers[id]) var line_number = lineNumbers[id];
      else{
        // There is no line for this keyword yet. Create a new one and add the line headers.
        line_number = qsValues.length;
        if(row['KeywordMatchType'] == "Exact") var keyword = '[' + row['Criteria'] + ']';
        else if(row['KeywordMatchType'] == "Phrase") var keyword = '"' + row['Criteria'] + '"';
        else var keyword = row['Criteria'];

        newRows.push([row['CampaignName'], row['AdGroupName'], keyword, id]);
      }

      qsValues[line_number] = [row['QualityScore']];
    }
  }

  // Check if everything fits.
  if(!config['skipIndividualKeywords']){
    // A spreadsheet can hold up to 2 million cells. Calculate if the new data will fit in with the rest.
    // With four rows needed for every keyword, plus one for every tracking run, this won't fit if there are more than 400,000 rows (header + 399,999 keywords).
    if(qsValues.length >= 400000){
      Logger.log("There are too many keywords to be tracked (" + qsValues.length + "). This tool can only track up to 399,999 keywords.");
      Logger.log("A summary will be logged, but individual keyword quality scores cannot be stored.");
      skipIndividualKeywords = true;
    }else if((qsValues.length + 1) * (sheet.getLastColumn() + 1) > 2000000){
      // This spreadsheet is full, a new one is needed.
      // Add new file.
      maxFileNumber++;
      reportFile = addReportFile(folder, "QS Report #" + maxFileNumber + " (" + dateString + ")");
      var newSpreadsheet = SpreadsheetApp.open(reportFile);
      var newSheet = newSpreadsheet.getActiveSheet();
      // Copy the first columns from the old sheet to the new one.
      newSheet.getRange(1, 1, lastRowNumber, 4).setValues(sheet.getRange(1, 1, lastRowNumber, 4).getValues());
      // From now on, work with the new sheet and spreadsheet.
      spreadsheet = newSpreadsheet;
      sheet = newSheet;
      sheetLastColumn = 4;
    }
  }

  // Store the keyword data in the spreadsheet.
  if(!config['skipIndividualKeywords']){
    // If there are new rows, add their line headers beneath the others.
    if(newRows.length > 0){
      sheet.insertRowsAfter(lastRowNumber, newRows.length).getRange(lastRowNumber + 1, 1, newRows.length, 4).setValues(newRows);
      sheet.autoResizeColumn(1).autoResizeColumn(2).autoResizeColumn(3);
    }
    // Add a new column with the tracked data.
    sheet.insertColumnAfter(sheetLastColumn);
    sheet.getRange(1, sheetLastColumn + 1, qsValues.length, 1).setValues(qsValues);
    sheet.autoResizeColumn(sheetLastColumn + 1);

    // Change file name to reflect the new date.
    // Find out which dates are currently noted in the file's name.
    var matches = /\((.*?)( - (.*))?\)/.exec(reportFile.getName());
    if(matches && matches[1]){
      if(matches[2]){
        // There's a start date and an end date.
        var startDate = matches[1];
        var endDate = matches[3];
        if(endDate != dateString){
          var newFileName = reportFile.getName().replace(endDate, dateString);
          reportFile.setName(newFileName);
        }
      }else{
        // There's just a start date.
        var startDate = matches[1];
        if(startDate != dateString){
          var newFileName = reportFile.getName().replace(startDate, startDate + " - " + dateString);
          reportFile.setName(newFileName);
        }
      }
    }else{
      Logger.log("Could not recognize dates in file name " + reportFile.getName() +". File name remains unchanged.");
    }
  }

  // Now take care of the summary file.

  // Get the total numbers.
  for(var key in qsStats){
    for(var i = 1; i  0);

  if(folderName == "") return currentFolder;

  // See if the folder is already there.
  var folderIterator = currentFolder.getFoldersByName(folderName);
  if(folderIterator.hasNext()){
    var folder = folderIterator.next();
  }else{
    // Create folder.
    Logger.log("Creating folder '" + folderName + "'");
    var folder = currentFolder.createFolder(folderName);
  }

  if(folderNameArray.length > 0) return getOrCreateFolderFromArray(folderNameArray, folder);
  return folder;
}

/*
* Checks if there is a folder for the current client account in the base folder. If not, the folder is created.
* Existing client folders are recognized by the client id in parentheses. This way, folders can be found again, even if an account has been renamed.
*/
function getOrCreateClientFolder(baseFolder){
  var folderIterator = baseFolder.getFolders();
  var regExp = new RegExp(AdWordsApp.currentAccount().getCustomerId());
  while(folderIterator.hasNext()){
    var folder = folderIterator.next();
    if(folder.getName().match(regExp)) return folder;
  }
  // Since no folder has been found: Create one.
  var newFolderName = AdWordsApp.currentAccount().getName() + " (" + AdWordsApp.currentAccount().getCustomerId() + ")";
  Logger.log("Creating folder '" + newFolderName + "'");
  return baseFolder.createFolder(newFolderName);
}

/*
* Creates a spreadsheet for QS tracking.
* Adds headers to the spreadsheet.
* Returns the file.
*/
function addReportFile(folder, name){
  var spreadsheet = SpreadsheetApp.create(name, 1, 4);
  var sheet = spreadsheet.getActiveSheet();
  sheet.setName("QS history");
  // Put in the table headings
  sheet.getRange(1, 1, 1, 4).setValues([["Campaign", "AdGroup", "Keyword", "ID string"]]);
  //sheet.getRange(1, 1, 1, 4).setFontWeight("bold");
  sheet.setColumnWidth(4, 1);
  var file = DriveApp.getFileById(spreadsheet.getId());
  folder.addFile(file);
  var parentFolder = file.getParents().next();
  parentFolder.removeFile(file);
  return folder.getFilesByName(name).next();
}

/*
* Creates a spreadsheet for the summary and stores it in the folder.
* Creates sheets for the Percentages and Averages.
* Populates header rows and columns.
*/
function addSummaryFile(folder, name){
  var spreadsheet = SpreadsheetApp.create(name);
  var sheetH = spreadsheet.getActiveSheet();
  sheetH.setName("Percentages");

  // Add the first column for the horizontal data table.
  sheetH.getRange(1, 1, 72, 1).setValues(
    [["All keywords"], [1], [2], [3], [4], [5], [6], [7], [8], [9], [10], ['Total'],
     ["Keywords with impressions"], [1], [2], [3], [4], [5], [6], [7], [8], [9], [10], ['Total'],
     ["Impression weighted"], [1], [2], [3], [4], [5], [6], [7], [8], [9], [10], ['Total'],
     ["Click weighted"], [1], [2], [3], [4], [5], [6], [7], [8], [9], [10], ['Total'],
     ["Conversion weighted"], [1], [2], [3], [4], [5], [6], [7], [8], [9], [10], ['Total'],
     ["Conversion value weighted"], [1], [2], [3], [4], [5], [6], [7], [8], [9], [10], ['Total']
    ]
  );
  sheetH.getRange("A:A").setNumberFormat('@STRING@');
  sheetH.autoResizeColumn(1);

  var sheetV = spreadsheet.insertSheet("Averages");
  // Add the first rows for the vertical data table.
  sheetV.getRange(1, 1, 4, 7).setValues([
    ["Date", "Average", "Average for keywords with impressions", "Impression weighted", "Click weighted", "Conversion weighted", "Value weighted"],
    ["Highest", "", "", "", "", "", ""],
    ["Lowest", "", "", "", "", "", ""],
    ["Average", "", "", "", "", "", ""]
  ]);
  // Add some formulas for maximums, minimums, and averages.
  sheetV.getRange(2, 2, 3, 6).setFormulas([
    ["=MAX(B$5:B)", "=MAX(C$5:C)", "=MAX(D$5:D)", "=MAX(E$5:E)", "=MAX(F$5:F)", "=MAX(G$5:G)"],
    ["=MIN(B$5:B)", "=MIN(C$5:C)", "=MIN(D$5:D)", "=MIN(E$5:E)", "=MIN(F$5:F)", "=MIN(G$5:G)"],
    ["=AVERAGE(B$5:B)", "=AVERAGE(C$5:C)", "=AVERAGE(D$5:D)", "=AVERAGE(E$5:E)", "=AVERAGE(F$5:F)", "=AVERAGE(G$5:G)"]
  ]);
  sheetV.getRange(1, 1, 1, 7).setFontWeight("bold").setNumberFormat('@STRING@');
  sheetV.autoResizeColumn(1);
  sheetV.autoResizeColumn(2);
  sheetV.autoResizeColumn(3);
  sheetV.autoResizeColumn(4);
  sheetV.autoResizeColumn(5);
  sheetV.autoResizeColumn(6);
  sheetV.autoResizeColumn(7);

  // Store the spreadsheet.
  var file = DriveApp.getFileById(spreadsheet.getId());
  folder.addFile(file);
  var parentFolder = file.getParents().next();
  parentFolder.removeFile(file);
  return folder.getFilesByName(name).next();
}

/*
* Replaces the About sheet in the summary spreadsheet with a fresh one from the master sheet. This way, the sheet (including the FAQ) stays up to date.
* Also replaces the Dashboard with a fresh copy (resulting in an empty sheet with the correct conditional formatting).
* If there's a new version, a sheet "New Version Available!" is added.
*/
function updateInfo(summarySpreadsheet, version){
  var templateSpreadsheet = SpreadsheetApp.openByUrl("https://docs.google.com/spreadsheets/d/1qnTYdpBCgHP_5u5eQcXmc5gP0NrOrBK51JnTCTlc0_g/");

  var oldSheet = summarySpreadsheet.getSheetByName("Dashboard");
  if(oldSheet) summarySpreadsheet.deleteSheet(oldSheet);
  templateSpreadsheet.getSheetByName("Dashboard v" + version).copyTo(summarySpreadsheet).setName("Dashboard");

  var oldSheet = summarySpreadsheet.getSheetByName("About + FAQ");
  if(oldSheet) summarySpreadsheet.deleteSheet(oldSheet);
  templateSpreadsheet.getSheetByName("About v" + version).copyTo(summarySpreadsheet).setName("About + FAQ");

  var oldSheet = summarySpreadsheet.getSheetByName("New Version Available!");
  if(oldSheet) summarySpreadsheet.deleteSheet(oldSheet);

  // Check if there is a newer version.
  var versionHistory = templateSpreadsheet.getSheetByName("Version History").getDataRange().getValues();
  if(versionHistory[0][0] != version){
    // There's a new version available (at least one).
    // Look for the row which has the info about the current (old) version.
    var oldVersionRow = 1;
    while(oldVersionRow  2){
        // The column for comparison is either the specified number of columns behind lastCol, or 2 (the first column with data).
        dataRanges.push(sheets['dataH'].getRange(statsRow, Math.max(2, lastCol - compareStepsBack), 11, 1));
      }
      dataRanges.push(sheets['dataH'].getRange(statsRow, lastCol, 11, 1));
      chartBuilder = chartBuilder.asColumnChart();
      break;
    case "line":
      var dataRanges = [sheets['dataV'].getRange(5, 1, lastRow - 2, 1), sheets['dataV'].getRange(5, vCol, lastRow - 2, 1)];
      chartBuilder = chartBuilder.asLineChart();
      chartBuilder.setOption("vAxis.maxValue", 10);
      chartBuilder.setOption("vAxis.ticks", [0,2,4,6,8,10]);
      chartBuilder.setLegendPosition(Charts.Position.NONE);
      break;
  }

  for(var i in dataRanges) chartBuilder.addRange(dataRanges[i]);
  sheets['charts'].insertChart(chartBuilder.build());
}

/*
* Tracks the execution of the script as an event in Google Analytics.
* Sends the version number and a random UUID (basically just a random number, required by Analytics).
* Basically tells that somewhere someone ran the script with a certain version.
* Credit for the idea goes to Russel Savage, who posted his version at http://www.freeadwordsscripts.com/2013/11/track-adwords-script-runs-with-google.html.
*/
function trackInAnalytics(version){
  // Create the random UUID from 30 random hex numbers gets them into the format xxxxxxxx-xxxx-4xxx-yxxx-xxxxxxxxxxxx (with y being 8, 9, a, or b).
  var uuid = "";
  for(var i = 0; i
[/spoiler]
Small Update March 22
I’ve updated the code a little to smooth out some spreadsheet operations. If the script runs fine, no update is necessary.
Update August 31
Google has sent out emails to anyone using scripts for QS reporting, warning us about a change. The Quality Score Tracker won’t be affected by this change. No action is required.
What Google changed: Keywords without a QS used to report a 6/10. Now they will report “–” or null. This is a good thing for advertisers since they now get a clearer picture.
As a result, you *might* see fewer QS 6 keywords in your reports and in the dashboard for this script. However, this only affects new keywords and keywords with very few impressions. Because of this, weighted averages (like the default impression weighted average) should be unaffected.
Small Update October 27
Fixed a minor bug that caused a Spreadsheet error in line 239 in rare cases.

Martin Roettgerding is the head of SEM at SEO/SEM agency Bloofusion Germany. You can find him on LinkedIn.
“Google recently launched a new version of its API that allows someone to download each Quality Score factor, along with its status (average, below average, above average) for every search keyword in an account” – are you going to add this layer of complexity? That’d be awesome!
Yes, I plan to, but I haven’t decided in what way this should be stored or represented in the dashboard. Do you have a preference?
By the way, if you want to see your own data on QS details: I’ve created a little script to download a keyword report including all QS fields. You can find it at the end of my post about QS factors: /2016/02/04/keyword-quality-score-up-close/
Heh, I Googled quality score history Adwords then got your V1 post, googled the same thing with “V2” saw your vv post, then searched v3 and saw this fresh awesome nugget 🙂 this is great!
Thnx for your efforts Martin, it looks promising. I’ll give it a testrun soon.
Very nice script Martin. I have added in the QS conditional formatting so I can see when the QS increased or decreased for a certain keyword. On the “QS Report” I have used conditional formatting with the formula =indirect(CHAR(COLUMN()+64)&ROW())>indirect(CHAR(COLUMN()+63)&ROW()) for green/increase and =indirect(CHAR(COLUMN()+64)&ROW())<indirect(CHAR(COLUMN()+63)&ROW()) for red – decrease.
Hi Liviu,
This is a fantastic idea! If possible, I’ll add this to the next version. Thanks for sharing!
Here is another coloring possibility https://docs.google.com/a/docs.loftrek.ro/spreadsheets/d/1TZMstYsAxRSliMKSl2nmGbiP0R9JlCDjjHTEZScJ7Us/edit?usp=sharing I have also noticed that remarketing display keywords are counted with 0 QS, this leads to an QS average difference (see bottom sum in the example) – =sumif(E2:E112,”>0″)/countif(E2:E112,”>0″).
Unfortunately, I can’t access the spreadsheet…
About remarketing keywords: Yes, I noticed this too late and now the script also tracks some QS 0 keywords. This does not affect the dashboard, though. The dashboard generates its charts from the data in the summary file. There are only values for 1-10 stored.
What’s still wrong is the total number of keywords that’s stored in the summary file, Percentages sheet, row 12. This number isn’t used anywhere, but is there in case you want to get the calculate numbers from the percentages. The other totals (keywords with impressions, etc.) should not be affected since, by default, only stats from Google search are tracked.
Anyway, I’ll fix this in the next version. Thanks for the heads up!
You’re welcome. I would be glad to be involved in the next version. If you want we can talk via Skype. I really like this project and I would like to help it’s expansion (also with the individual QS components).
I have changed the rights to the google doc and I have also inserted a new graph suggestion for the “Impression weighted QS”. Thanks a lot!
Hi Liviu,
Sounds interesting, where did you ad this code?
Regards,
Roy
I’ve shared this on my LinkedIn, thanks so much again Martin. the PPC community owes you 🙂
Thanks Martin,
a good job
Hi
Hey,
The weighted QS means that each QS is multiplied by the number of clicks/impressions/conversions/value and then divided by the total number of the same metric.
For example, lets say you have to keywords with QS 5 and 7. The unweighted average is 6.
Lets say the first keyword has 10 clicks, the other one has 20. Now the click weighted average is (5×10 + 7×20) / (10+20) = 190/30 = 6.33
The weights are supposed to help you evaluating your QS situation. Most people prefer impression weighted QS because it means that keywords with many impressions gets more weight while keywords without impressions get none.
Beautiful, thanks Martin!
Hi thank you for the script. I implemented the script a while but can only see last 6 days’ history data, is that what it meant to ?
Hi Sherry,
Thank you for the feedback! No, that’s not supposed to happen…
Is it only 6 days of data in the “QS report” spreadsheet, or in the dashboard, or both?
Hi Martin,
There is only last 6 days data in both “QS report” and dashboard
Hi Sherry,
If both are missing, it suggests that the script never got to the part where data was to be written. Either there was an error or the script didn’t run…
Both should be documented in the script logs on the scripts page in your account. Could you check for an earlier time when the script ran (when no history was stored), click on the logs link there and tell me what the log says?
Hi Martin,
Thanks for the reply. The logs are successful, if i go to the worksheet URL provided in logs, the history are there. But if I directly go to my Google drive’s folder and open worksheet, i can only see last 6 days. The two URLs’ encoding are a bit different.
Hi Sherry,
This is interesting. So there are different files… there are a few scenarios I could think of:
1) The script’s user somehow changed and the files are now in different Google drives. If you go to https://drive.google.com – can you find both spreadsheets there? (the one with all the data and the 6 days one)
2) The script setting “baseFolder” has been changed at some point. Then the script wouldn’t find the old files and start new ones in the new folder.
3) The folder’s name in Google Drive has been changed at some point. Then the script would basically do the same as in 2 and recreate the folder to start fresh.
For 2 and 3: Are there different folders for the Quality Score Tracker in https://drive.google.com ?
Hi Martin,
Thank you for the reply
It’s 3) Yes there are two folders, I changed folder’s name at some point, the renamed folder has all record inside 🙂
Thank you very much !
I have tried changing the name of these sheets and it is not working. I have several accounts I want to track for and this would be easier if I could change the name. Can someone help?
Hey Julie,
I’m here to help! What exactly isn’t working? What sheets would you like to rename?
Martin,
I tried changing this and adding the client name and ID and it still just named it Quality score tracker.
I am wondering if I didn’t change in the right place. I am not terribly familiar with scripts.
“baseFolder” : “Quality Score Tracker/”,
/*
* Whether to add a client folder in the base folder (resulting in a folder like “Quality Score Tracker/CLIENT_NAME (123-456-7890)/”)
* The folder’s name is not important, as long as the Adwords client id remains in it.
* This is useful if you want to track multiple accounts with this script.
*/
“useClientFolder” : 1,
Hmmm, can you tell me again what you’re trying to accomplish? Sorry, I may be a bit slow tonight…
The script basically puts it’s files into a client folder, which is located in the base folder:
/ baseFolderAsSpecified / Client Name (123-456-7890)
In this folder, the summary file and the report files are stored. You can change the summary file’s name. You can also change the client folder’s name, but this has to be done in Google Drive by just changing the actual folder. As long as the client’s id remains, the script can find it again.
With this structure, you can use the script in several accounts using an MCC login. Since they’ll all use the Google Drive from that login, all of your folders will be in the same base folder, so that it’s easy to keep them close together.
Hi Martin, first of all, thanks for your amazing job.
I’m attempting to run the script on a very big account but this following message occurs : “Exceeded maximum execution time”.
Does someone already had this issue and knows how to solve it ?
Regards,
Hi Vincent,
That’s the first time I heard about that – there must be a lot of keywords. On occasion I’ve seen the QS Tracker taking a bit longer than usual (like, 5 instead of 2 minutes). If you’re in luck, the next time it will do just fine.
Unfortunately I don’t think there’s a way to get around this issue. The script has to go through all of the keywords. It already employs the fast way to do that.
One alternative here would be to only track some of your keywords. If the account is so big I imagine there’ll be a lot of keywords without impressions. You could exclude them by changing this line:
var awql = “SELECT Id, Criteria, KeywordMatchType, CampaignId, CampaignName, AdGroupId, AdGroupName, QualityScore, Impressions, Clicks, Conversions, ConversionValue FROM KEYWORDS_PERFORMANCE_REPORT WHERE Id NOT_IN [3000000, 3000006] AND Status = ‘ENABLED’ AND AdGroupStatus = ‘ENABLED’ AND CampaignStatus = ‘ENABLED'”;
to:
var awql = “SELECT Id, Criteria, KeywordMatchType, CampaignId, CampaignName, AdGroupId, AdGroupName, QualityScore, Impressions, Clicks, Conversions, ConversionValue FROM KEYWORDS_PERFORMANCE_REPORT WHERE Id NOT_IN [3000000, 3000006] AND Status = ‘ENABLED’ AND AdGroupStatus = ‘ENABLED’ AND CampaignStatus = ‘ENABLED’ AND Impressions > 0”;
This way, only keywords with impressions > 0 will be tracked. It’s not perfect, but I imagine it’ll do the trick for your account. It will affect metrics like number of keywords per QS, but all of the weighted metrics (like impression-weighted QS) are unaffected – and those are the ones that cound.
Let me know if this helped.
Hi Martin,
Thanks a lot for your answer, it works very well now. It totally does the trick for this account. As you said, many keywords don’t have impressions, that’s why the script exceeded the limit given by Google.
Hi Martin,
Firstly, as people have mentioned before, this is fantastic!
I’ve been looking through the script, and was wondering whether there is any way to filter which parts of the account are looked at in terms of quality score, and if it was possible to filter it by campaign or label – any thoughts?
Thanks!
Hi Callum,
thanks! Yes, you could tweak the script to just select some keywords for tracking. Look for the line that starts with var awql = “SELECT
The keywords to track are selected there. In the WHERE part of the statement you see some conditions and you can easily add new ones, like “AND QualityScore < 5" or "AND CampaignName = 'Something'" or "AND CampaignName CONTAINS 'something'".
What's not available here are campaign labels. The report here is about keywords and you can only refer to keyword attributes, like keyword labels.
To do this with campaign labels you'd have to code a little more. Basically you'd select the campaigns from the label, collect their IDs and then put them into the statement above, making something like "AND CampaignId IN [1843523, 7423423, 547654241]".
HTH
Martin
Perfect, thanks Martin – I’ll give your suggestions a go and report back!
Martin, there is a slight mistake in script for option “activeKeywordsOnly’. For it in row 170 you need to exclude ‘AND Status = ‘ENABLED’ AND AdGroupStatus = ‘ENABLED’ AND CampaignStatus = ‘ENABLED’. Otherwise row 173 won’t work.
Ooops, you’re right. Thanks for pointing this out! I’m fixing it now.
Hi Martin. I’m trying scripts for the first time and owing to the plethora of scripts available to “give a go” I chose yours because of my interest in QS and that you actually reply to threads!
I have followed instructions and have found that I have an error message reading ”
Invalid reporting query. (line 174)” Please see http://prntscr.com/bwi9fe
Hope you can help set me on my path!
ah..I figured it. This works at the account level and not MMC level.
Is this correct? Is it advisable to schedule this monthly?
Many thanks for this body of work. Amazing!
Hi Resh,
Yes, this is correct: The script only works at the account level (for the moment).
Thanks for the kind words 🙂
Martin
Hi Martin,
Love the script, very helpful to find the nuggets of gold to make accounts that much better.
I’m running into an issue on a new account, in the logs it states:
“Service error: Spreadsheets (line 239)”
Are you able to provide any insight into what may cause this error?
Hi MDaniell, were you able to figure out the line 239 error? Thanks!
Hey,
sorry for getting back to you guys so late. I believe I found and fixed the problem. I’ve update the code above – let me know if it solves the problem.
Martin,
Thanks for being with us, and big thanks for the script.
I’m experiencing the same issue. Ran the script twice, reinstalled it.
Now I’m receiving “Service timed out: Spreadsheets (line 240)” message.
Thank you.
Try turning off the AutoFilter if it is applied in the spreadseet
Through the “Log” tab.
I’m having the same error, and I’ve just installed the script, like 30 mins ago.
Thank you Martin! this is great script!
Can you help me?
I would like to use this script for different campaigns separately. But there are the same sheets for different scripts in Google Drive and it is overwriting. How can I change the code to creating different sheets for each one of the scripts?
@martinrttgerding:disqus Thank you so much for this useful tool!
I just tried running it but unfortunately am facing an invalid error in line 174 as shown in the SS, despite running it in the account level. Is there something am doing wrong?
http://prnt.sc/caehmg
Hi Dana,
Sorry for getting back to you so late. By the way, thanks for the screenshot, this is very helpful.
Google seems to be having problems with reporting at the moment. We’re seeing a lot of random failed reports in our various applications. The problem you reported seems to be the same thing. Since it appears to be a random thing, I’d guess that the script should work fine the next time you run it. Or does the problem persist?
Thanks for the reply! Unfortunately it presist. I would LOVE to test it out. Please let me know if you find a way around this.
Hey Dana, I’m sorry for taking so long. I’ll get back to you, but I’m a bit behind at the moment…
Hi Martin,
This tool looks incredibly helpful–thank you for supporting it! I am having this precise problem – line 174, which is the same line in Dana’s screenshot, with the same error message.
Hey, sorry for taking so long. If one of you could paste the script configuration, I should be able to find an answer. Could you copy and paste lines 13-82 here?
@martinrttgerding:disqus Thank you so much for this brilliant tool.
I just found out that in the week of September 12 , 2016, we’ll start seeing null Quality Scores (designated by “–” in the table).
Source ( https://support.google.com/adwords/answer/7050591?hl=en&utm_source=awfe&utm_medium=referral&utm_campaign=notifications&authuser=0 )
Hey,
The script should be unaffected by the changes. To be sure I ran a simulation with some keywords reporting “–” and there was no problem.
Your numbers might change a little bit due to Google now truly reporting that former QS 6 keywords actually have no QS. The fluctuation should be minimal, though.
Hi Martin, Is there a need to make any adjustments in the script because of the upcoming Google QS update which gives a value NULL (‘–‘) back to keywords that are generation almost no impressions and clicks?
Hi Marc,
The script shouldn’t be affected by this, so there’s no action necessary. I’ve added a note about this in the post.
Martin, this is awesome!
Quick question though. Does this script still automatically create and update the labels in the AdWords interface like V2? If not how would you suggest I implement this feature?
Hi Mitchell,
The script doesn’t use labels anymore. If for some reason you still need them, I’d suggest you copy and adapt v2 according to your needs. But I think v3 should already have everything you need for QS tracking 🙂
Hi Martin,
I got this error “This script is currently not authorized to run in your account. Please start the authorization process again.”
Anything I can do?
Had the same problem. Every time I try to authorize I get the same message.
Just Logout from al other google accounts and keep the one for which you want to use the script
Hi Greg, I had solved while ago and it was due to email level of access to adwords and APIs, have you managed to do it?
Very interested in this but the link to download it seems to be broken. When I click on it, it re-routes me back to this page. Thanks for anything you can do. 🙂
Thanks for sharing! Is there a way to track just certain campaigns or keywords?
Hey,
Yes, if you tweak the script a little. I’ve updated the FAQ in the dashboard to include a description how to do this.
Hello Martin!
Loving your script, and works on pretty much all my accounts, but on two of them i get this exact error :” Service timed out: Spreadsheets (line 234)” . Any idea what it might be ? Same line 234 is on both the accounts…. Don’t know how to resolve it as there is literally no difference in the script or the amount of keywords on the accounts in question vs the ones that work….
Similar issue here, except that it’s line 239.
Hey Stein-Thore,
I couldn’t find an explanation for this error. A service timeout sounds like a temporary thing… Any chance it works now?
Hi Martin,
Thank you so much for your help! Unfortunately I’m still seeing ‘Service timed out: Spreadsheets (line 239)’. I copied the script from the expandable box above and replaced the existing one – is that the correct step to take? Thanks again.
Hi Mike,
Apparently it’s the same problem in both lines. It makes no sense, but I managed to find other people who had the same problem with different scripts. Apparently it’s an old problem that Google refuses to fix…
I may have found a workaround and updated the script again. Could you try it out and tell me if it works?
Drat. Service timed out: Spreadsheets (line 240). What’s interesting (at least to me) is that the two Google docs think they’ve been updated. Nothing appears to have changed on the sheets, but revision history says ‘last edit made 6 minutes ago’ for my most recent attempt to run the script. Not sure if that’s helpful. I really appreciate you trying to fix this!
Argh, this is unfortunate… I was under the impression that it was only specific calls to the spreadsheet that fail, but apparently they all fail at that point. Basically, in the beginning of the script it works fine and at some point it doesn’t. I’ll keep digging, but right now I’m unsure there is a way to fix this in the script.
Anyway, something else might help: I read that someone had just replaced their spreadsheet with a copy. So if you’d just copy the report spreadsheet, remove/rename the original and name the copy like the original it might solve the problem.
Thanks Martin. Copying, removing, and then renaming the copy with the original also didn’t work. However, I just deleted the report Google Sheet altogether (kept the Dashboard + Summary) sheet, and reran the script. The script ran properly, and the QS report sheet now only has data on in since today (10/27/2016), but the Dashboard + Summary still has all the historical data PLUS today’s. So that’s a win in my book. Thank you again for the awesome script and your help troubleshooting it!
Ah okay, then I guess the problem was somehow connected to the spreadsheet file. Thanks for your feedback!
Interesting script.
I noticed in the trackInAnalytics function, you left in the Analytics ID for I’m guessing your own account. Shouldn’t that value be updated by the end user?
Yes, that’s my own account. It’s not intended to be updated as it has no further use beyond basically sending a “ping”.
I wanted to know how many people actually use the script, but I didn’t feel comfortable to actually track anything that’s even remotely personal. That’s why the information sent is kept to a minimum: the script’s name including the version (“QS Tracker v3.0”) and a random number (required by Analytics).
Understood. Thank you
Hi Martin,
Thank you so much for sharing and updating this awesome script!
Is it possible to track expected CTR, ad relevance and LP relevance on a daily basis as the Quality Score is tracked in this case? Could you please share a script for this if you have it?
Hi Martin,
I’m getting the error: Service timed out: Spreadsheets (line 231) Is there any update on this issue as i seen you’ve discussed similar issues below?
Thanks,
Mike
I also received an authorization error for this script. Does anybody know how to resolve it?
Wow! Great script. Actually using it on a daily basis since few months and it’s really a nice tool.
Life before this script < life after this script.
Hi Martin,
I love this script, and have been using it daily for over a month now. Two quick questions, though:
1) I started using the script on 10/21 and it returned quality scores for roughly 20k of the 22k keywords it was tracking in account X. Starting on 11/4, it began returning only 8k quality scores. I thought this was due to some campaign changes made by another analyst (which weren’t major but it was the only thing I could think of). However, since copying the script over to account Y i noticed that the script was returning only 1k account Y quality scores for 11k keywords, which kind of throws my theory out the window. The rest of the keywords in both accounts are returning dashes “–“. Any idea what could be causing this?
2) I also attempted to copy the script to account Z but each attempt to run the script yesterday and today results in a time out error. Any ideas here?
Thanks again, despite a couple of issues I’ve had recently this is by far the best script out there. I really appreciate your work 🙂
Tom
Hi Tom,
Thanks for your kind words 🙂
About the first question: Google has changed the reporting of quality scores for keywords in October. Keywords without enough data (usually: impressions) used to display a 6/10 but now report just those two dashes. This is actually an improvement since the old 6/10 was meaningless and could give you the wrong impression.
About your second question: Is this a script timeout (ie the script goes over 30 minutes) or a service timeout from Google Spreadsheets? If it’s the latter, I have no good explanation, but there’s a comment thread about this below. There, Mike Pierce found the solution to remove the QS report sheet so that the script would re-create it. It worked fine after that.
If it’s a script timeout I assume the account is really, really big…? In this case I could come up with a workaround (make the script skip over keywords without QS / with dashes only). Let me know and I’ll get back to you.
Cheers
Martin
Hey Martin,
Yes, the timing out account is quite big, and I believe it is a script timeout as the error is “Exceeded maximum execution time.” A filter that excludes null values would be incredibly helpful! If you could do that that would be great.
Thanks,
Tom
If a table column headings apply AutoFilter script fails.
Service error: Spreadsheets (line 240)
Do you plan to add the details of the components of Quality Score?
CreativeQualityScore
PostClickQualityScore
SearchPredictedCtr
Hey, sorry for the late reply. Yes, I started working on this, but can’t tell when the new version is finished.
One problem I haven’t solved yet is if and how to store these components for each keyword: Three extra columns, separate report files, … any input is welcome.
Hi Martin, Thanks for the nice script.
I have a problem appears on line 175 showing this message:
ReferenceError: “AdwordsApp” is not defined. (line 175)
is there anything I can do to fix it?
Hi Wasfii,
That sounds as if you’re running the script on MCC level. Currently, it only works on the account level. Let me know if this doesn’t solve it…
Thank you so much for creating and maintaining this script. It’s been extremely useful!
I have a problem I hope someone can help with — I accidentally moved the Google Drive folder that the script was connected with, and now I’ve ended up with 2 dashboards. One covers everything before 12/13, and the other everything after.
Is there any way to re-combine these files?
Hi Joseph, sorry for taking so long to reply. You could combine them manually, by just putting everything on the sheets “Percentages” and “Averages” in the right place (make a copy of the file to be sure). The “Dashboard” sheet itself will be redrawn the next time the script runs. Then it should again reflect the whole time.
Do you still plan to extend this great tool to work with MCC accounts soon?
Yes, the next version is on its way, but I don’t know when it’s finished. Not in 2016, that’s for sure 😉
Thanks Martin looking forward to the MCC version! Yeah 2016 already behind us in Asia…
Thanks for the script, works like a charm.
I originally got an error that it couldn’t save my script, but I have 5+ google accounts logged in on Chrome. When I swapped to an incognito window with just my AdWords account logged in, the script worked. Champion!
Hi Martin,
just uploaded the script into my Adwords Account and I get following Error message
Deze actie verhoogt het aantal cellen in de werkmap tot boven de limiet van 2000000 cellen. (line 236)
what should I do?
Kindly,
Maria-Cristina
Hi Maria-Christina,
This shouldn’t have happened… the script first checks if all the data doesn’t need more than 2 million cells, but apparently this went wrong in some way. By any chance, did you change something in the reports file?
A quick solution I can offer is that you skip logging the history for each individual keyword and only use the dashboard. This can be done by changing the setting “skipIndividualKeywords” (line 67) from 0 to 1.
Hi Martin,
it finally worked. One thing I was wondering was if we can actually get the QS to look back into all time. Right now it only looks back until July 2016.
Second thing is, yesterday I exported all the data out of Adwords and checked the average QS and there it says 5.6 but in your Report it shows 4.6 So i was also wondering how you make your calculation to get to the 4.6
Little info, I rum my report to check the data on a weekly base.
Thanks already
Hi Maria-Cristina,
Unfortunately you can’t get historical data for QS. That was the initial reason to make this tool: Recording QS so that you could analyze it later. Earlier versions did just that. This one does a little more 🙂
About average QS: There are several ways to calculate an average QS. You can just take the plain average, but that means that keywords with very little traffic are just as important as your most important keywords. A more meaningful way is to weight QS according to impressions or another metric.
It works like this. Say you’ve got only two keywords:
– keyword X has a QS 2/10 and 1 impression
– keyword Y has a QS 10/10 and 99 impressions
Your average QS is (2+10)/2 = 6. In this, your low QS keyword drags your average QS down, Using impression weighted QS the calculation looks like this: (2*1 + 10*99)/(1+99) = (2+990)/100 = 992/100 = 9.92. This number much better represents what is actually happening in your account.
This impression weighted QS is what’s displayed in the dashboard by default. It looks at data from the last 30 days.
The script also records other averages, including the unweighted, plain average QS. You can find all that data in the dashboard on the sheet “Averages”. To display one of those as a chart, you can edit the settings at the beginning of the script.
Cheers
Martin
Thanks a lot for this explanation Martin you really helped me a lot.
Hey Martin, thanks for the script. So far it was running great until the 31.03 and than just suddenly (whithout me touching it, it stopped showing me data. it is running every day without errors for 2 minutes but is not loading data into my spredsheet anymore. Have you ever experienced this ? I tried to figure it out myself now but i don’t know what happened. It happened to both scrips from both campaigns
Thank you so much for this script! Finally I have more vision on what I’m doing overall.
Let’s speak honestly.
This is fucking awesome.
Thanks a lot for your contribute.
Hi Martin,
Thx for the great script. I added an account selector function into the script to make it possible to run the script as an MCC -script or account-selection script:
var accountSelector = MccApp.accounts().withIds([“xxx-xxx-xxxx”,”xxx-xxx-xxxx” etc.]);
var accountIterator = accountSelector.get();
while (accountIterator.hasNext()) {
var account = accountIterator.next();
MccApp.select(account);
Thanks Martin and Matthieu, such a help!
Hi Martin, This looks ideal, but where in the code would this go/replace?
Hi Martin,
I really like your Script but I have some questions:
About a month ago I changed some Landing Pages and now I want to see the difference in Quality Score before and after the changes. (all changes are in one campaign) I started using the script a few days ago so there’s no historical data in the spreadsheet.
1. Is there an option to create the comparison before / after the changes? Or is it only possible to start tracking QS from moment it ran for the first time?
2. What would be the best setting to see general QS average week over week? Should I select statsTimeframe last30days or last7days? Or doesn’t make this any difference?
3. The first times I ran the script there’s not so much data. This will be more every time I run the script right?
Hope you can help me.
anyone having issues pasting this into the editor. It pastes on 1 line instead of filling out.
Hi Martin! First of all thanks for the amazing script! I started testing it last month and it’s been running smoothly ever since. I noticed you added a setting for the base folder, is it possible to set a subfolder as the base folder? For example: folder/subfolder/subfolder/. Thanks in advance! 🙂
Is there any way to get a daily email that will show only the Keywords that had a change in the QS from the previous day?
I’m wondering if this functionality is available as well. I look forward to your reply Martin!
Hey, version 2 of the QS Tracker can do this. It doesn’t cover all keywords in huge accounts like v3 does, but you can label your most important ones and keep an eye on them. Both tools don’t get in the way of each other, so you can use both at the same time.
Here’s v2: /2013/01/26/adwords-quality-score-tracker-version-2-0-now-with-labels/
Thanks! However, I already tried V2 but I didn’t manage to get it working properly. I also experienced the “Couldn’t get spreadsheet ID from label description: Marks Keywords for QS tracking. Results are here: …” error when I tried to run the V2 script.
I entered the script, changed the e-mail address, ran the script once, tagged the keywords I wanted to track with the “Track QS”-label that is generated by the script, and tried to run the script again. Unfortunately, it gave the error message stated above. Could you help me out here? I didn’t find the answer to this error message in the previous comments in the V2-article.
Hi Martin,
This script is absolutely amazing – many thanks for sharing this with us!
The only thing that would make this better for me is to incorporate a breakdown of the QS similar Karooya’s script (http://www.karooya.com/blog/free-adwords-script-to-analyze-quality-score-in-detail/).
Thanks!
Hi Martin, Abslutely great script. Thanks for sharing. I have been using this for about 3 months now. Recently I noticed that after adding a couple of new campaigns to the account. The new keywords didnt get added to the tracker. Even though it shows all the newly added keywords on the spreadsheet, It is not tracking their quality scores and shows blank in place of quality score. Am i doing something wrong?
Hi Manali,
Just to make sure: You see the keywords in the first few columns of the report but there are no quality scores? Did you scroll to the right (to see the latest columns)?
Hi Martin,
Thank you for a great script! But why is the script including keywords from display campaigns? Those keywords never show QS so it just mess up the google sheet with to much kewords that show nothing. Is it a way I can make the script not show display campaign key words?
Nice script, Martin!
I was wondering if you had any plans of integrating cost weighted QS? As it is now with impression/click weighted QS, these might be giving you the wrong impression because of branded searches. If search volume for your brand name goes up (or you up your impression share) than your impressions & clicks for branded keywords might get a lot more volume compared to generic keywords, and make your impression/click weighted QS go up. Yet, excluding your branded campaigns, the evolution might well be the other way around.
Oh yeah, also a breakdown by campaign/ad groups would be great as well for seeing where you’ve got the most work. With the latest QS for each keyword and using data for last 30 days for example.
Hi,
I wanted to run the script twice. Firstly for all Campings – secondly just for campaigns that contain a certain name.
I was about to ask the question here if this is possible, when I had the idea how I could solve it – and in worked 🙂
1. Step: Get the script to create a sub-new folder:
Find this line an ad “/My Campaign Name”
“baseFolder” : “Quality Score Tracker/My Campaign Name”,
Change 1 to 0 in this line:
“useClientFolder” : 0,
2. For a better overview in your spreadsheets, this would give the “dashboard + summery” file a unique name
“summaryFileName” : “Dashboard + Summary – My Campaign Name”,
What did not work is to give the “QS Report”-File a unique name.
I tried this, but is made no change.
reportFile = addReportFile(folder, “QS Report My Campaign Name #1 (” + dateString + “)”);
reportFile = addReportFile(folder, “QS Report My Campaign Name #” + maxFileNumber + ” (” + dateString + “)”);
If someone does have a solution to that, I’d be happy.
If this is valuable for others, it could be integrated into the “About + FAQ” tab within the “Dashboard + Summary” file.
Blessings,
Irene
Update: I did delete the “Dashboard + Summary” and “QS Report” files within Google Drive and ran the script again. The new Filed did have the new names 😀
Very nice. Thanks for the share.
Hi Martin,
So stoked to have found this script, but having some trouble running it. I keep receiving the following error:
Invalid reporting query: KEYWORDS_PERFORMANCE_REPORT. (line 175)
Are you able to help QA/fix the error?
Thanks,
Niki
Hi Nicole,
Did you change any settings in the script? The most likely source for this error would be this setting:
“statsTimeframe” : “LAST_30_DAYS”,
Maybe the quotes went missing? If that doesn’t fix it, you could try copying the script again (without any changes) or paste the things you changed here, so I can check.
Ah, that fixed it! Thank you so much!
Hi! 🙂
Any idea on how I could fix this?
ReferenceError: “summarySpreadsheet” is not defined. (line 523)
Thanks,
Izabela
Hi Izabela,
There is no code in line 523. The first time “summarySpreadsheet” is needed is line 529… looks like your version of the script is missing six lines somewhere. I’d recommend to copy and paste the orginal script again. If the problem persists, I’d need to see the config settings you made in order to help.
HTH
Martin
Hi, Martin!
Many thanks for the answer! I think I didn’t copy the entire script. Just tried again and it works.
Thanks,
Izabela
Hello,
I’m getting this error: Status: Not completed: User error
Does anyone know what that is and how I can fix that?
/Solvi
Great script! Except for 1 Time-out error. I work with multiple accounts and the first one worked just fine. Its as if it doenst know where to log?
First thank you so much for your great guide, but for me, it’s not useful, because after I have Authorized, I faced in “This app isn’t verified” Error 🙁
Can you please let me know about it?!
Hi Martin, thanks very much for these! It looks absolutely mind blowing. Unfortunately, in my end it says: System Error and then in preview it says this: We’re sorry, a server error occurred. Please wait a bit and try again. (line 403)
Any idea? :/
Hi loopka,
There’s nothing special in line 403… it calls DriveApp.getRootFolder(), which is just some basic functionality and nothing that should break. Maybe there’s a problem on Google’s end… I’d try again and it should probably be back to normal.
Hey loopka. Same problem occurs for me. Will report back tomorrow.
Love the script btw 🙂
guys I tried to install it for my new client’s account and it doesnt run. I am getting : Not completed: System error. I tried past it few time, no success. In this same time this sam script runs without any problems on other accounts.
Hi Martin
Is it possible to run this script to get historical QS data? Say from the this year, year to date?
Thanks!
Craig
Hi Craig,
Late answer, sorry.
This script stores the current Quality Scores whenever it is run. It doesn’t look back. However, you can download that data directly from the AdWords interface using the historical QS columns.
HTH
Martin
Hi Martin – thanks for this awesome script.
I’m getting the error message “Invalid reporting query: KEYWORDS_PERFORMANCE_REPORT. (line 175)”. Unlike Nicole below, it doesn’t appear to have to do with the timeframe setting. It’s likelier related to fact that it’s an MCC account and I’m trying to run it only for a specific account – could you please advise on required changes?
Many thanks in advance!
Hi Stefan,
This script is meant to be used in a regular account, not in an MCC. You can just run it in the child account and it should be fine.
SUPER NICE. Thank you!
Thanks
I use the script for multiple account, almost all of them work just fine, but only one of them gives an error. I already checked all comments here and tried to delete the generated sheets and started the script again. All without any luck unfortunatly.
The error:
All files are stored at
https://drive.google.com/drive/folders/1eBcsxFmVOrXshhshwsraJFzuqTeLtYFr6Qb2mOC
The dashboard is here:
https://docs.google.com/a/degeus.de/spreadsheets/d/12CpI1LyIJOIM1-XeRi7dNPuB0shshshshpuKfF7E6-eBQR2cPLc/edit?usp=drivesdk
Service timed out: Spreadsheets (line 242)
Could it be that the account is to big? It is the biggest account we manage. Hopefully there is a solution – as it is a great script!
Thanks in advance!
Thanks Martin
Martin, this is amazing work, and I can’t believe you would just post it for free. That’s big Karma. I installed it and it ran perfectly, first try. Thank you. I have been working (with paid help) to optimize my Adwords account for http://www.shopwudn.com and http://www.techsmrt.com. My average QS is 5.33 (6.26 impression weighted). That’s seems pretty poor to me although I don’t have any good basis of comparison to other e-commerce operators. It appears I have work to do.
Thanks for your efforts Martin – really good. I’m trying to get this working on our MCC account for certain accounts, I see that you’re thinking about adding this as a feature, any immediate plans?
Hi Mark,
Thanks! I still think about making an MCC version with a couple of new features, but I’m not sure it will happen. Not soon, anyway…
Hi,Thank you so much for that script. I would like to ask if the chart in dashborad can show monthly average QS, not just comparison of daily avg QS. Thank you for answer 🙂
Hi Gréta,
A month late, I’m sorry…
The chart will display the values from the times the script was run. If you run it daily, the line chart will contain days, if you run it monthly, each point will represent a month.
I’m afraid I didn’t include a way to average values by month or anyway else in the script. However, the data is all there in the spreadsheet. You should be able to build something with it that suits your needs.
Martin
Hi Martin, the script is running fine in my account but when I check the log there is no link to the google drive, just a list of my campaigns with how many clicks they received in the previous week. Any ideas what the issue could be? Thanks
Hi Steve,
You’ve probably solved this already as I’m very late to reply… anyway, what you describe sounds like the AdWords Scripts sample script that appears the first time you create a script. Replace it with this script (or simply create a second one) and it should work fine.
Excellent, thats working now. Thanks very much!
Hi Martin,
Thanks for the great script. We installed it and your script had been working for quite some time but then got the notification that the script finished but with errors. The log stated: “The document cannot be modified. Perhaps it has grown too large? (line 236)”. We tried creating a new script but it then said it “failed due to system errors”: “Service timed out: Spreadsheets (line 240)”
Any idea why these problems are occurring? Could it be because we have over 400,000 keywords in our account?
Hi Mallory,
Sorry it took me so long to look into this.
The number of 400,000 keywords is very likely the problem. The script can store a maximum of 399,999 keywords due to the maximum number of cells a Google spreadsheet can hold.
I recommend you change the setting “skipIndividualKeywords” in (line 67) to 1. This way the script will not even attempt to store individual keyword quality scores, but instead just prepares the dashboard. This won’t cost you any data because Google has made historical QS available through reports some time ago.
Does this help?
Thanks for looking into this–yeah, that is what I’ve done. Thanks for your help and for the great script!
Hi Martin, does this script work for single or manager account?
Thank you.
D-
It works for a single account. If you want to track multiple ones, you have to implement it in each one. By default, every account stores its files in its own folder on your Google Drive.