
Since Google announced to introduce attribution models very soon, advertisers are excited for the new data driven model. The other day, I got to take a closer look and see how it actually works.
What is data driven attribution?
Googles data driven attribution method is supposed to better attribute conversions to ad clicks than the other, rules-based models. Instead of attributing conversions according to a fixed rule (like last click takes all), data driven attribution aims at finding the correct contribution a touchpoint made. To do so, it looks at click paths, both converting and non-converting, and uses machine learning to find the right weights.
You may have noticed: The term “machine learning” basically means I don’t know how exactly it works, but it somehow sounds good. Googles hasn’t given much detail beyond that, but used this example in last year’s AdWords livestream:
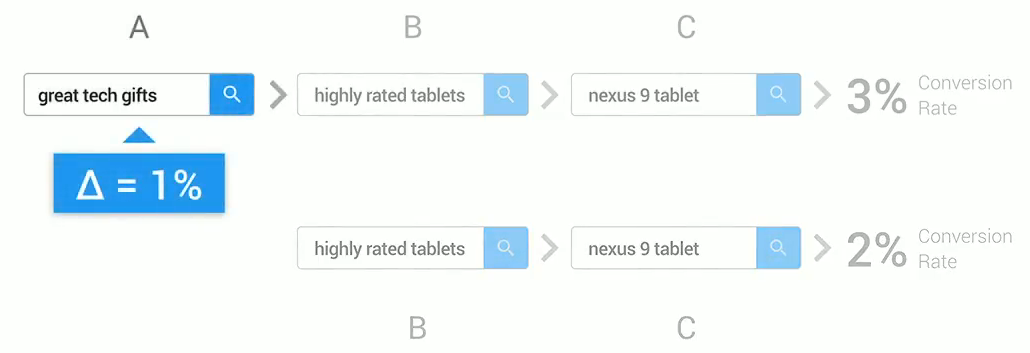
Here we have two click paths: One converting at a rate of 3%, another one converting at 2%. The difference between those two paths is that the first one has an additional touchpoint with the keyword “great tech gifts”. The additional 1% conversion rate is therefore attributed to this keyword, meaning the keyword gets attributed one third of the conversions from this path.
While this example is fairly straightforward, reality is usually not that simple and Google’s data driven attribution is virtually a black box. This means that advertisers basically have to trust the algorithm.
Simulating data driven attribution
 While the method itself is a black box, the results are not. Last week, Google has quietly added data driven attribution to the attribution modeling interface. Using this tool, we can see and analyze our results as if they’d been attributed according to the new method.
If you’re not familiar with the tool, you can find it at Tools > Attribution > Attribution modeling. It lets you simulate and compare the results that different attribution models would show for your campaigns, adgroups, and keywords.
Note that data driven attribution can only be simulated for conversion actions with at least 800 conversions, and for accounts that received at least 20,000 clicks, both in the last 30 days. If your account doesn’t meet these requirements, the option to simulate data driven attribution won’t even show up. Otherwise you’ll find it pre-selected, along with last click attribution.
The simulated data for data driven attribution is available starting February 11th 2016. If you select a date before that, the results from data driven attribution will actually reflect last click attribution.
My simulation
I compared data driven attribution to the regular last click model for a client. This is what it looked like:
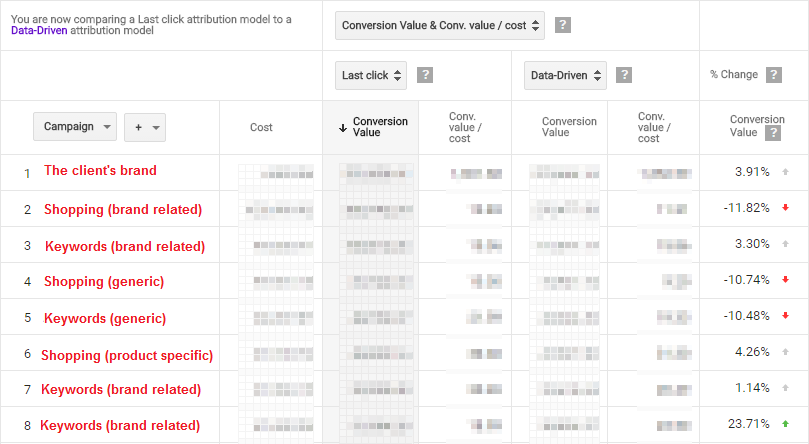
I had to pixelate the costs and conversion value for client protection, but the interesting part is there: In the last column you can see the actual difference between the two models. Read: For the first campaign, conversion value would be 3.91% higher if we used data driven attribution.
By the way: This is just one client. Other clients have different results, so this is not to be generalized.
I wrote the campaign type into the first column. As you can see, this client uses my shopping approach with campaigns segmented into generic terms, brand related terms, and product specific terms. The results are surprising, at least to me:
- Generic terms (“running shoes”): –10.74%
- Brand related terms (“asics running shoes”): –11.82%
- Product specific terms (“asics gt 2000“): +4,26%
My structure basically segments keywords according to how far they are down the buying funnel. Generic terms are at the beginning of the funnel, so I’d expect them to be undervalued by first click attribution. And in fact, first click attribution would add 15% to this campaign. Data driven attribution, however, still sees them overvalued attributes more than 10% of their value elsewhere.
The product specific terms on the other hand are far down the funnel, basically collecting people who are ready to convert. However, the data driven approach sees them undervalued by last click attribution and adds a few percent.
For the regular keyword campaigns the same is true: Generic terms are evaluated even worse according to data driven attribution whereas campaigns further down the funnel get more conversions attributed to them. If we take a closer look, there are indeed big differences between campaigns. There’s even a smaller one (not in the screenshot) for generic terms that saw an increase over 900%, suggesting that data driven attribution really looks at individual cases.
What’s most surprising is the first campaign, the client’s own name. This brand campaign does little to nothing to convince anyone to buy, but it’s at the end of many converting paths, leading to strong results from a last click perspective. Yet Google’s data driven attribution attributes even more conversions and value to this campaign.
So how are we doing?
When analyzing these results I found myself thinking “oh, this campaign is really doing (or worse) better than expected” – as if data driven attribution held the answer to how these campaigns were really doing. With complex issues like attribution it’s easy to fall back on easy answers, like the idea that an algorithm probably knows best. “Data beats opinion” and all that.
Except that when it comes to the brand campaign, I actually do know better.
I can understand how the system arrived at the conclusion that the brand campaign had so much value: Users intending to convert are more likely to have a touchpoint with the brand campaign. However, the system is designed to trace conversions back to touchpoints. It cannot distinguish between cause and effect, but it’s hard wired to interpret touchpoints as the cause of conversions.
The example of brand conversions demonstrates well where data driven attribution has its limits. Now the question is whether the approach works well overall or not.
Opening the black box
Even though we can’t exactly see how data driven attribution comes to its conclusions, we can check the conversion paths that lead to its decisions. To do this, we can use the Top Paths report (Tools > Attribution > Top Paths) and compare it to the simulation. It actually contains all converting paths that are considered in the simulation as well. To get the more detail, we can drill down to the keyword level in the report and in the simulation. To further narrow things down we can also minimize the timeframe to one day.
Now we can start with any result from the simulation and look it up in the paths. For example, if a keyword has 0.5 conversions according to data driven attribution, you can search this keyword in the converting paths (I recommend downloading the entire report and do the rest in Excel).
Here’s an example of a keyword that got attributed 0.3 conversions and only appeared in one path:
![]()
Since these keywords were for completely different things, I imagine I would’ve attributed more than 30% to the last one.
Another keyword that only appeared in one path:
![]()
In this case the keyword got awarded 0.01 Conversions, which seems to be the absolute minimum. This seems to be OK.
It’s hard to look beyond a few small examples, which excludes cases where more data is available and makes this analysis far from representative. But it suggests that there are cases we can agree with and others, where we can’t… and probably many cases where it’s debatable (maybe including my examples).
Assessment
Data driven attribution sure isn’t perfect. In fact, it could never be perfect since the decision to convert happens inside a user’s head. This is why we could endlessly debate even the simple examples from above without ever finding out the truth.
Google doesn’t sell its data driven attribution as the perfect method. According to the principle that all models are wrong, but some are useful, Google seems confident that its approach is at least better than the others.
It’s hard to evaluate whether this is actually true. Google’s advice is to simply try it out, change bids based on the new model, and see whether the total number of conversions increases. The problem: It’s usually hard to distinguish between the effects of such changes and the regular fluctuations that happen in almost all accounts.
Looking at the results from the simulation, especially regarding brand traffic, I’m rather sceptic about the new approach. In my opinion, the distinction between cause and effect is the central problem with attribution – regardless of machine learning and other buzzwords. I am, apparently, the only one who sees this as a problem, though.
Biggest deal 2016?
In any case, attribution is a big deal and the chance to select a different attribution model could have a big impact on the way we run our campaigns. I’m actually surprised that Google has been rather quiet about it, both officially and in their communication towards agencies. I expect this to change once the new attribution models are available in all accounts. After all, it fits well with Google’s narrative about micro moments, which is about valuing all touchpoints.
My guess is that Google will then try to establish data driven attribution as the new standard method for bigger accounts. After some time they might even do one of these migrations with an opt-out form to get lazy advertisers on board.
For most advertisers, the process could go rather smoothly: Change the attribution model, wait and let bid management do the rest. The hardest part will be to explain the perceived loss of performance that comes with switching from the last click model to any other one, due to the bigger time lag (the lag between the last click and the conversion is naturally the shortest).
After an advertiser has switched to a new model, there’s probably no reason to deal with the topic anymore, which is why I don’t expect it to be something we’ll be talking about forever. Still, hot topic or not, this is probably the biggest deal for AdWords advertisers in 2016.

Martin Roettgerding is the head of SEM at SEO/SEM agency Bloofusion Germany. You can find him on LinkedIn.
Data driven attribution will change the enterprise’s marketing budget, the enterprise’s budget will growth much more than last click interactive, and growth faster, over the years I always intuitive to run the last click non conversion ads, It’s glad to see the change and thank you for sharing! 🙂
Thanks Martin for writing this. I’ve grown sceptical of Google’s black box features. I’ve never found CPA bidding to be superior to manual bidding on a finely tuned account that is managed well. I’ve lowered CPA’s by 25% reverting an account to manual bidding. If Google can’t beat me when it comes it bidding, I find it hard to believe it can attribute conversions any better. Google also has an incentive to show more conversions, so that you will bid more, and they generate more revenue.
Hi Martin
I switched one of my accounts from last click to data driven just to see what will happen. It’s a big account with lots of conversions and clicks.
So far the conversions have dropped by 30% and CPA has increased by almost 100% on a daily basis. I suppose that in a few days it will get back to normal because I see that many conversions have been attributed to the previous days. I found the past days, in some cases 30 days before, reporting more conversions.
We will see… I really hate the time lag in reporting. It doesn’t let you make aggressive changes.
Have you tried data driven? How many days it takes to fully retrain smart bidding?
Hi Dimitris,
Can share your feedback now about how is performing data driven attribution now?
Hi Arun
CPA has decreased after a couple of weeks but it remains a little bit higher than the normal.
I cannot say that I saw a noticeable increase of conversions and the conversion lag has increased a lot which is normal for this attribution model. Although Google recommends data driven I must admit that I feel more comfortable using last click.
Also If your client is very sensitive on CPA fluctuations I would recommend to keep using last click or wait for the public release of the new Google Attribution product which uses data driven taking in mind cross device and cross channel conversions. In both cases ask your Google account manager to send you the data driven switch card. It’s not just a simple click on the back end if you want to go by the book.
Thank you very much Dimitris for you valuable feedback. As you suggested I will wait for Google attribution public release.
ohhh