
In recent years, Google has made many changes to the search result pages. Thanks to our large collection of ad position data, it’s possible to analyze some of the bigger trends over time.
Before we get to the data, I’d like to emphasize to points. First, this analysis of historical data has little significance for our current day-to-day business. Second, we have many fluctuations in the data. These should be taken as a sign that our data isn’t as comprehensive as we’d like it to be. Please don’t read anything into individual spikes.
Going from Right to Bottom
One development that invites a closer look happened in the beginning of 2016 on desktop computers. Back then, Google removed ads from the right-hand side and put them below the organic search results.
We can see the effects of this change reflected in the click-through rate of the first “other” position. “Other” positions include everything that was not placed above the organic search results, i.e. side and bottom ads. Until the change, all “other” positions on desktop were always side ads. Since then, “other” means “bottom”.
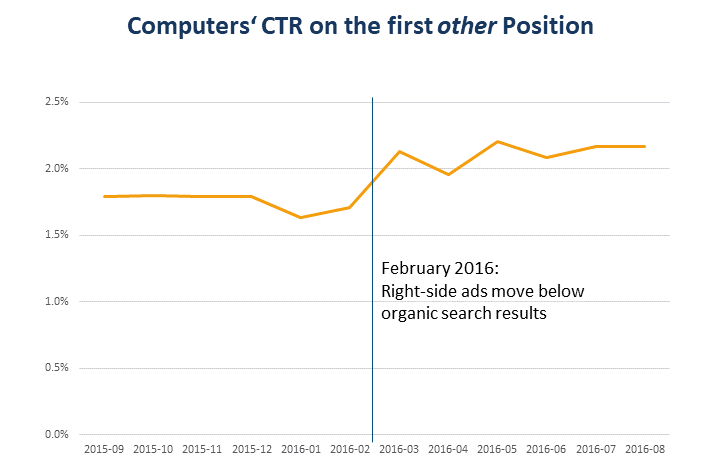
As you can see, click-through rate increased when Google made the change. According to our figures it’s about 20% higher than before. The new placement not only made room for shopping ads, but it also had a CTR advantage of its own – at least for the first position.
In addition, the fourth top position was created. At that time, its click-through rate was around 10% which probably would’ve been enough to compensate for the loss of right-side ads altogether.
CTR Trends
Plotting the click-through rates of the individual positions over time led to an unexpected picture:
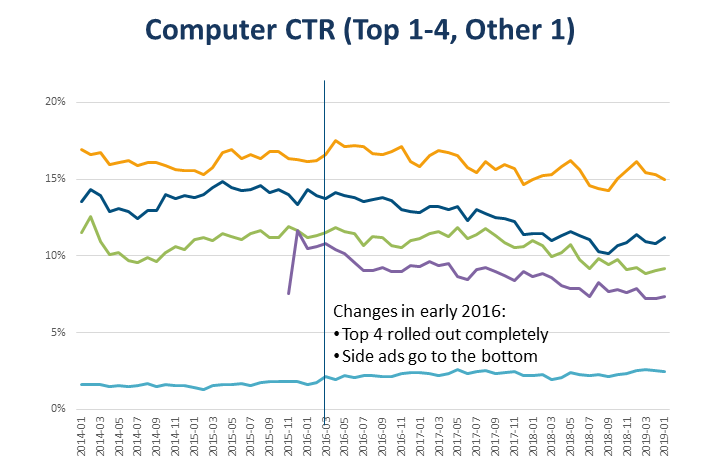
While click-through rates increased slightly until around the beginning of 2016, they have since fallen on all top positions. The lower positions, on the other hand, are have always been improving.
For mobile devices, things are similar:
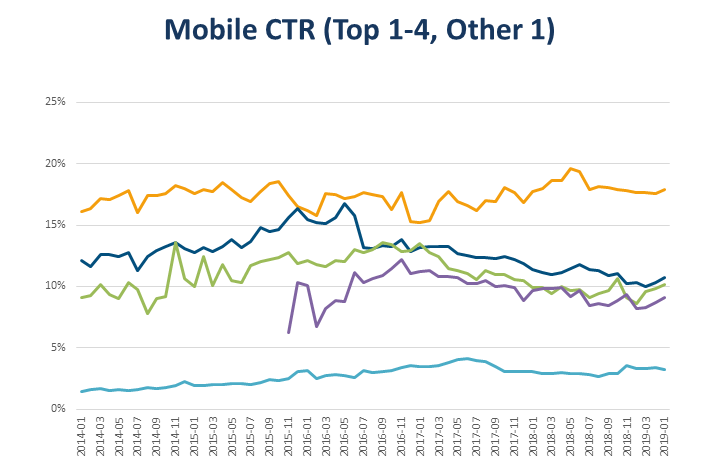
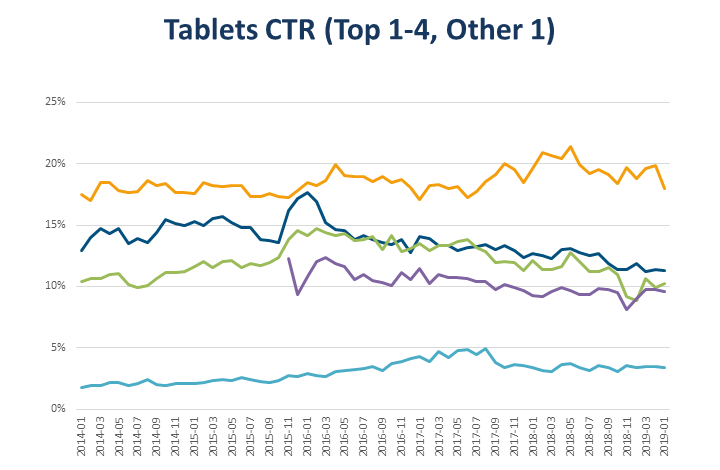
Here, however, the top position continues to improve even after 2016. On the remaining top positions, CTR’s still declined. This is also the case on tablets:
I would’ve expected CTR’s to be rising everywhere due to Google’s continuous testing and optimization. New ad formats, especially due to extensions, are also usually introduced based on CTR improvements.
However, there are some possible explanations for these developments. Shopping ads in particular draw clicks from all other results without us being able to evaluate the effect. It’s also possible that Google displays more ads and thus clicks are just spread over more paid results.
Trends for the future?
I assume that these trends of the last three years are just history. Whether things will continue like this in the next three years, I cannot conclude from that.
Nevertheless, we can extrapolate for fun. If everything were to continue
linearly, then in 2042 the top ad on computers wouldn’t receive any clicks anymore.
On mobile devices and tablets, the CTR trends point upwards. On mobile, CTR would reach 100% in 2166. On tablets that point would be reached in 2234. Or, better yet:
In the year 2346, every mobile user will click on the top ad – twice.
Standard vs. Expanded Text Ads?
In mid-2016, Google introduced expanded text ads (ETAs), replacing the old standard text ads (STAs). I would’ve liked to present an analysis of the difference between those ad types.
Unfortunately, our data only revealed the futility of such an analysis. Whether ETAs actually work better than the previous STAs cannot be examined on a large scale, since one ad type ultimately replaced the other.
Of the old ads, only the most successful were kept. Those had, of course, rather good CTR performances. On the other hand, all new and untested STAs have long since disappeared.
Responsive Search Ads
Another new type of ad was introduced in mid-2018 with the addition of responsive search ads (RSAs). To be honest, I don’t think it makes much sense to compare it to previous ad types. Nevertheless, this is what the picture looks like for my agency (responsive search ads in orange):
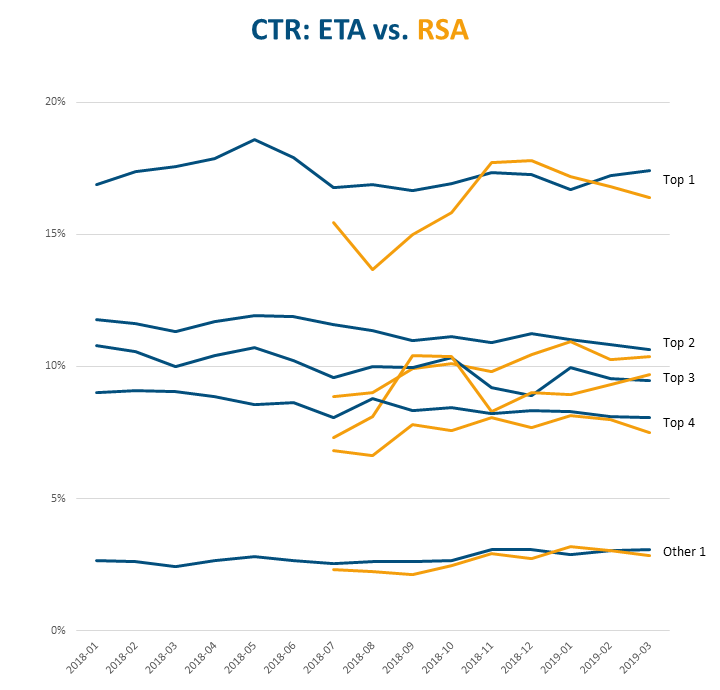
As you can see, there were strong fluctuations in the beginning when adoption began and RSAs got few impressions (I left out the June RSA results because they were all over the place). These days, things are calming down and the two ad types’ click-through rates are close to each other.
I know that others have already published their opinions about the superiority of ETAs or RSAs in terms of CTR or other metrics. Personally, I don’t see any reason why these ad types should have different KPI’s on their own. Ultimately, they both result in the same ad format (strictly speaking, RSAs started with an additional headline and description, but this was rarely shown before ETAs got those, too).
Instead, I think it depends on some circumstances which ad type works better:
- Initially, responsive search ads are always at a disadvantage because the system must first learn which combinations of ad elements work well.
- If responsive searches can put together meaningful variations that would otherwise not be covered, they have an advantage. For example, if there is one ad that focuses on price and another that focuses on service, then a responsive search ad that covers both aspects could produce better results.
- If all relevant and meaningful combinations are already covered by other ad types, responsive search ads can catch up at best.
In addition, in most cases both ad types run in parallel and Google automatically optimizes ad rotation to deliver the most promising variant. This makes a direct comparison more difficult, to say the least.
What’s next?
That’s it for the analysis of position performances over time. There’s more data, going back to the beginning of Google AdWords, but it’s rather sparse and not really useful for a bigger analysis.
The next part will probably be the last one of this series, but I think it’ll be a good one: We’ll take a look at quality score.

Martin Roettgerding is the head of SEM at SEO/SEM agency Bloofusion Germany. You can find him on LinkedIn.