
In the second part of the big Google Ads position is about devices: Is it more important to be first on mobile or on desktop computers? And what about tablets?
In the first part of this series I described how we got this (so far) unique set of exact position data and I presented the first results. It turned out that the absolute top position’s click-through rate clearly stands out, whereas the other top positions are closer together.
Today we take a look at the same data, this time segmented by device.
Absolute Top vs. Top
A simple evaluation of click-through rate by position and device is summarized in the following chart:
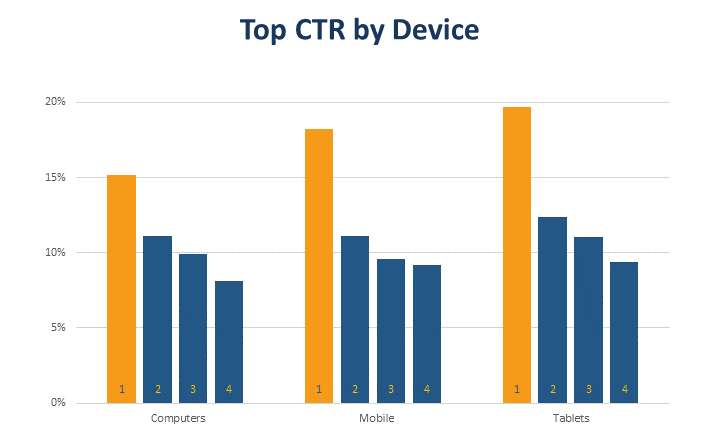
The big difference between the absolute top and the following positions runs through all device classes. However, it is much greater on mobile devices and tablets than on desktop computers. Based on this, you might conclude that bid increases have a greater effect on mobile devices and tablets compared to computers.
Another thing to consider is that Google doesn’t always show ads on all four top positions. However, our data suggests that these positions are more often filled on desktop computers and less often on tablets or mobile devices. This would support the conclusion above.
Generalizing these results and relying blindly on them would certainly not be a good idea. However, it seems safe to conclude that performance on different devices responds differently to bid changes. In case you bid manually, trying to get the last bit out of your campaigns, handling device types individually is probably a good idea.
In any case, whether separated by device or not, the best way to assess the effect of bid changes is to look at bid simulations.
Click-through Rates in Comparison
Where are the click rates highest? We can now answer this question quite safely. The following graphic is essentially a new arrangement of the one above:
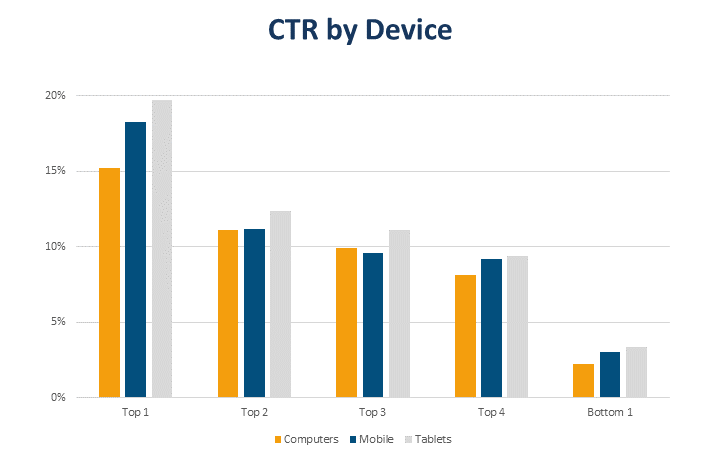
Tablets beat the other device types on all positions in terms of click-through rate. This came as a bit of a surprise to me, because with the small screen, mobile users actually have fewer alternatives. At least for the first position, I would have expected the highest CTR on mobile.
Overall, the ranking seems to be: tablets > mobile > desktop. I know that it doesn’t always look like this in the chart above, but I believe this is an issue with our non-representative data. Overall, the ranking seems to have been stable since at least 2015 (charts above are all about 2018).
For 2013, however, our data looks a bit different:
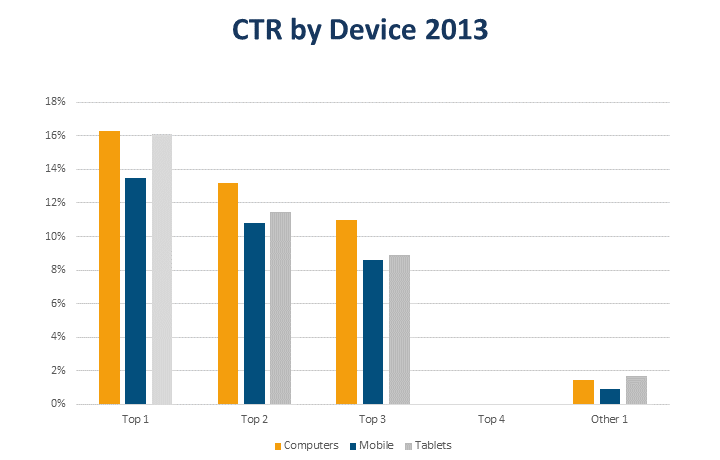
At that time, mobile click-through rates were still well below those of the other devices, while desktop computers performed better.
In practice, we don’t really have to care about these device-specific differences in click-through rate. Since they apply to everyone, there are no advantages or disadvantages. Just be aware that there are differences and that they have an effect on the blended averages people like to look at for ad testing (which leads nowhere, as demonstrated here).
Data Quality, again
The subdivision into device classes has once again made it clear to me that our data is not representative. In some cases, things look different if you take out individual customers who, for example, were particularly strong on mobile. For this reason, I am careful drawing conclusions.
What’s next?
As implied in this article, our data goes back a few years. Next time we will take a look at the past and what happened when Google made a few changes.

Martin Roettgerding is the head of SEM at SEO/SEM agency Bloofusion Germany. You can find him on LinkedIn.